

Count Up
3sA big bold number counts up to your figure with a satisfying landing pop and a label beneath.
Animated counters, candlesticks, market tickers and clean charts for reports, pitch videos and trading content.
A big bold number counts up to your figure with a satisfying landing pop and a label beneath.
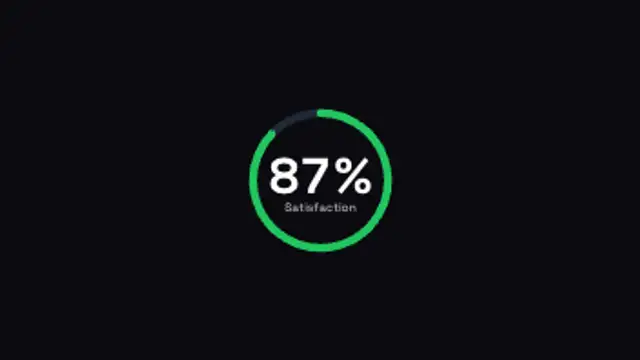
A progress ring sweeps to your percentage while the number counts in the center. Clean data storytelling.
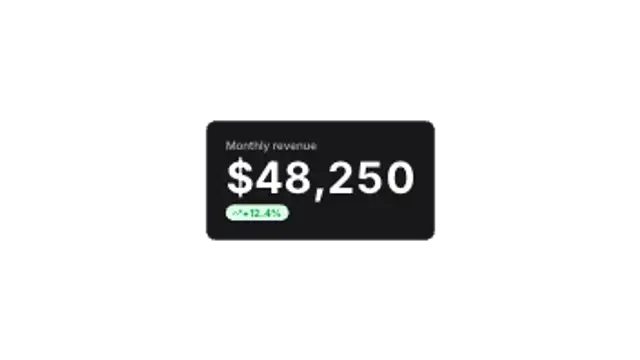
A dashboard-style card slides up, counts to the metric and pops a growth badge. Built for business updates.
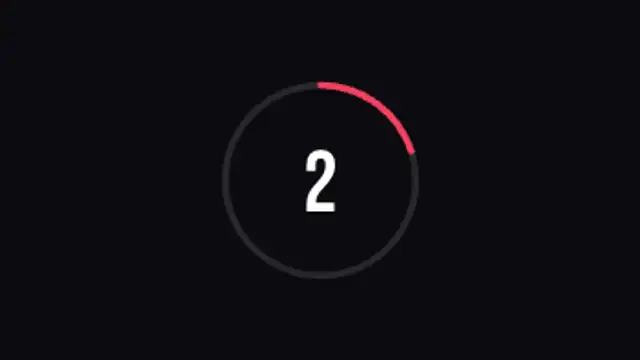
A classic countdown with a draining ring and bouncing digits. Set the start and end numbers.
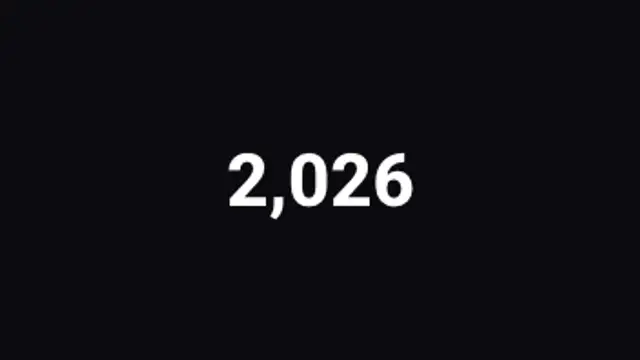
Digits spin like a mechanical counter and lock into your number from right to left. Tactile and premium.
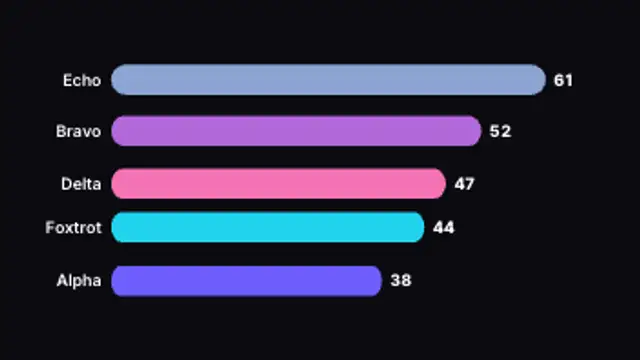
Ranked bars grow and overtake each other as the values climb, with live counting totals. Type your own data.
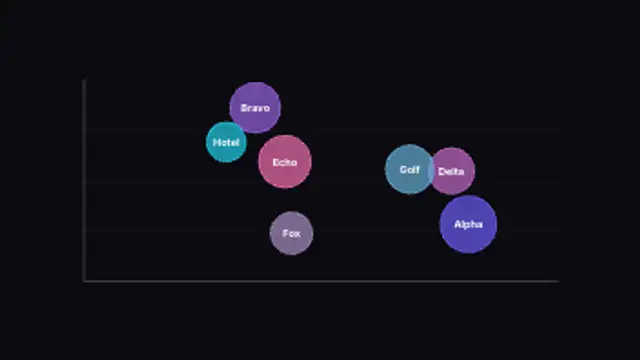
Bubbles sized by value pop onto an x/y plane for three-variable comparison. Type your own values and labels.
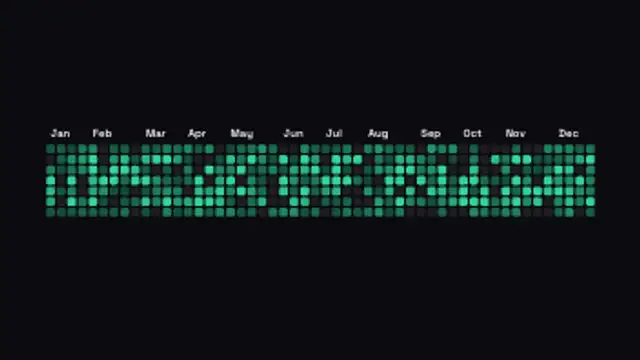
A year of day cells lights up week by week in a contribution-style grid. Edit the colors, month labels and variation.
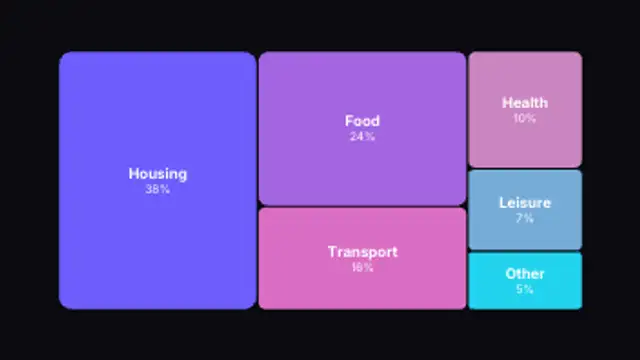
Nested rectangles sized by value tile into the frame to show part-to-whole breakdowns. Type your own data.
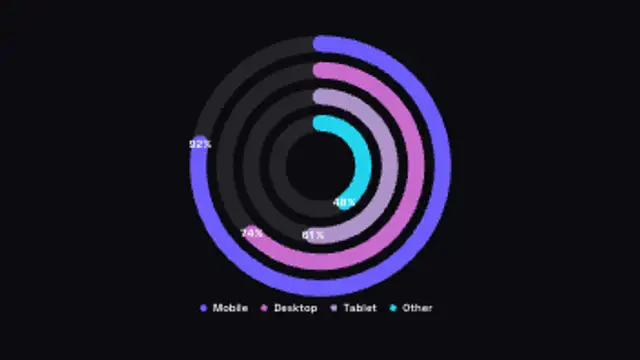
Concentric arcs sweep out from the top, one per category, with counting values. Type your own data.
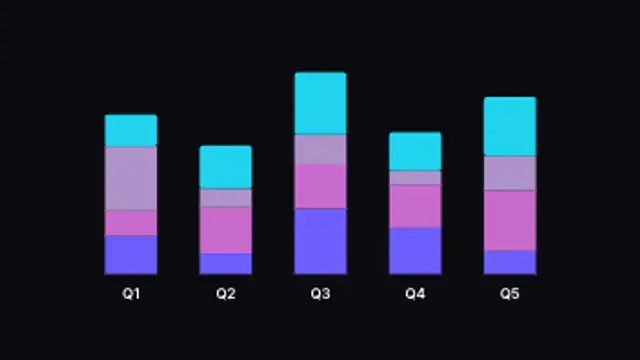
Columns fill bottom to top in stacked segments, showing composition across categories. Type your own data.
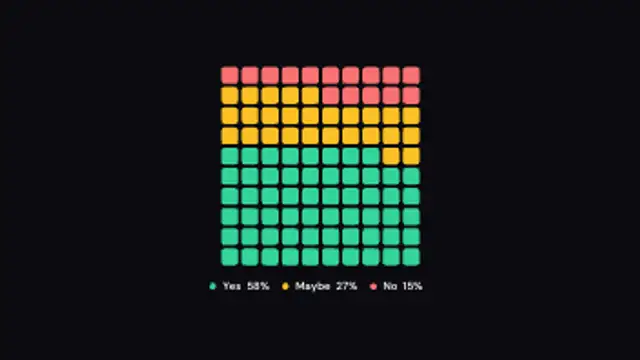
A 100-square grid fills cell by cell to show a percentage split, with a legend. Type your own category shares.
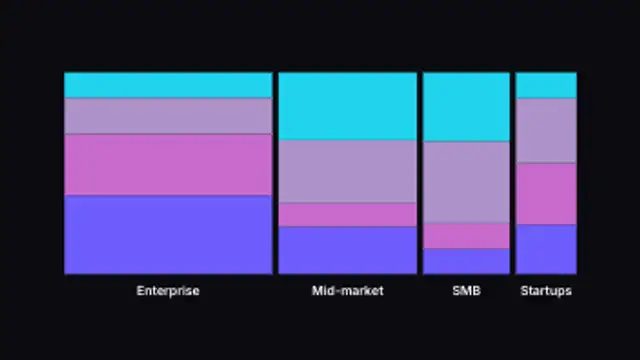
Variable-width columns rise and stack into segments, showing size and composition at once. Type your own category sizes.
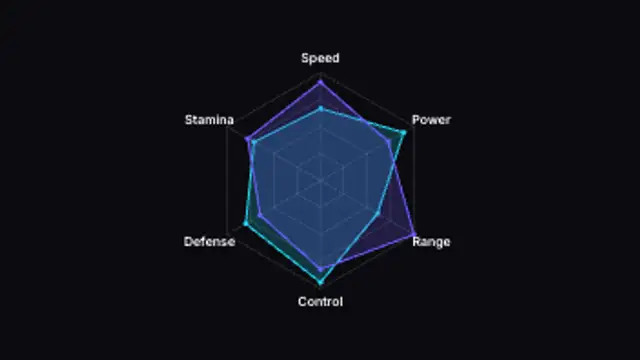
A spider chart sweeps open across its axes and a second series overlays it for side-by-side comparison. Edit the data.
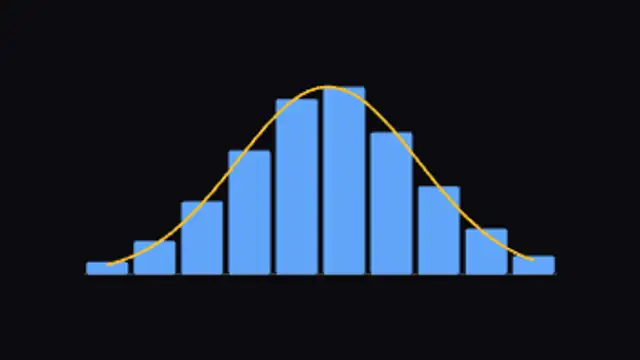
Binned columns rise together and a smooth bell curve draws over them with a mean marker. Type your own bins.
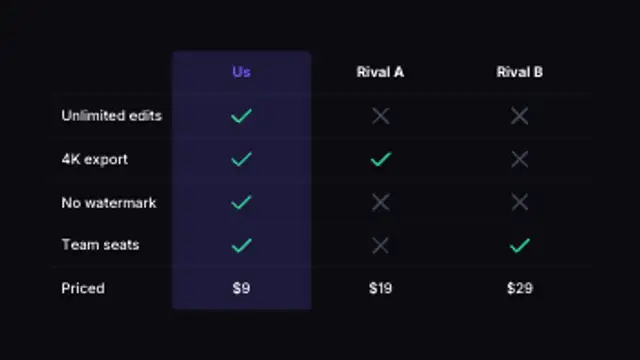
Rows and columns fill in with checks, crosses and values, highlighting the winning column. Type your own cells.
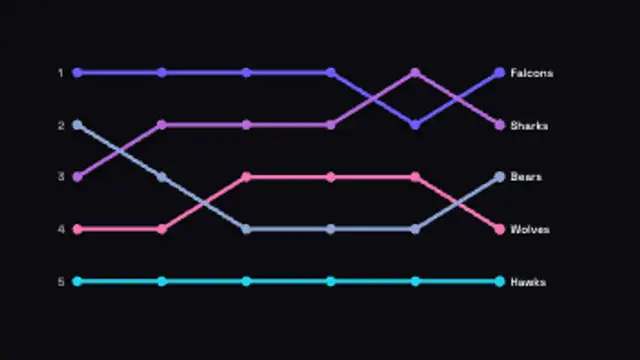
Ranked lines weave between positions over time, crossing as they overtake each other. Type your own entries.
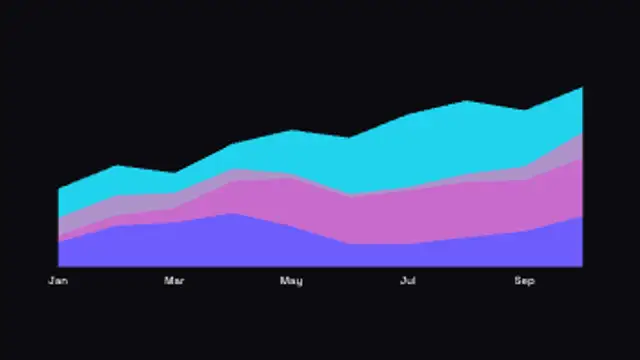
Layered bands flow across time to show composition, wiping in left to right. Type your own totals.
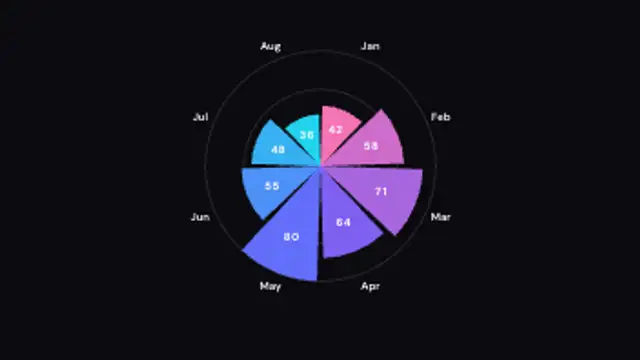
Equal-angle wedges grow outward from the center by value, like a Nightingale rose. Type your own data.
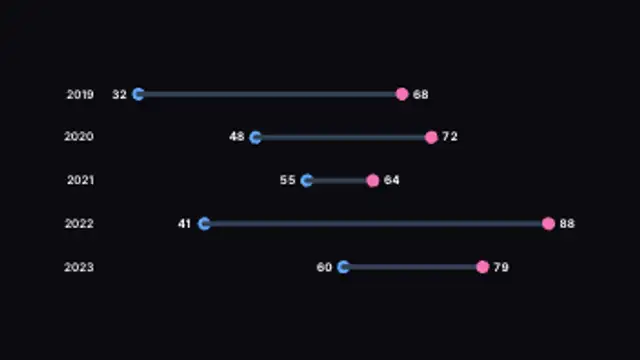
Two dots per row connect with a bar to show the gap between them, growing into place. Type your own paired values.
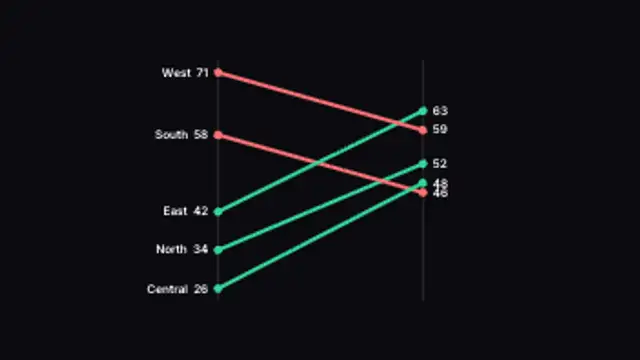
Lines tilt between a before and after axis, colored by whether each item rose or fell. Type your own paired values.
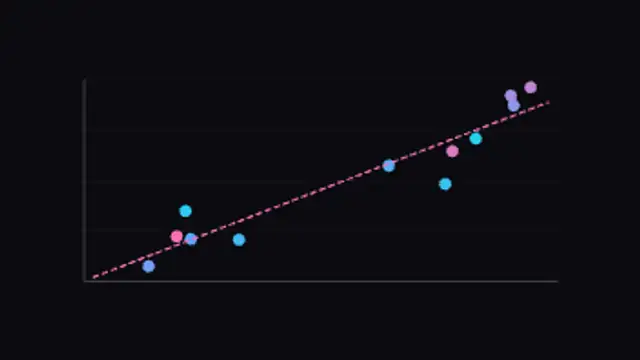
Data points pop onto an x/y plane and a dashed trend line draws through the correlation. Adjust the count and variation.
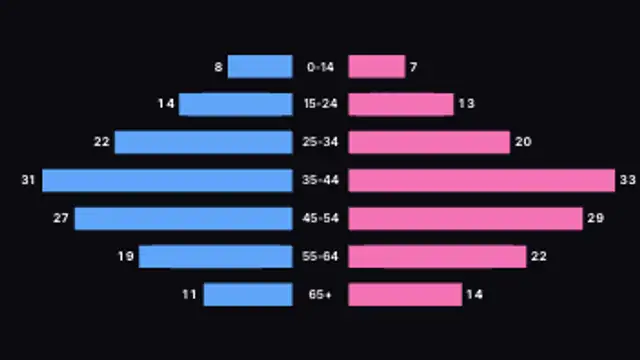
Two series grow outward from a centered label column for back-to-back comparison. Type your own paired data.
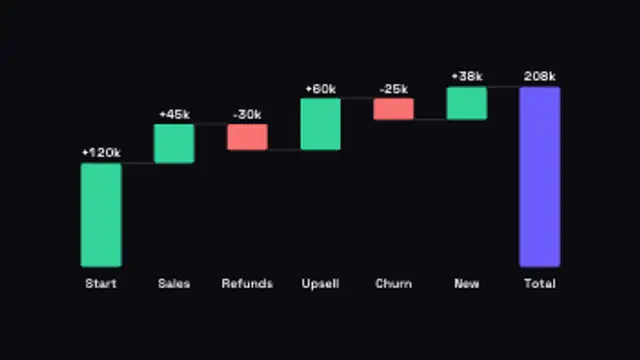
Floating bars step up and down from a running total, with connectors and a final total. Type your own +/- changes.
Editing and previewing are free. You only spend a credit when the finished file lands on your machine.
5 free HD downloads on a new account · No card required