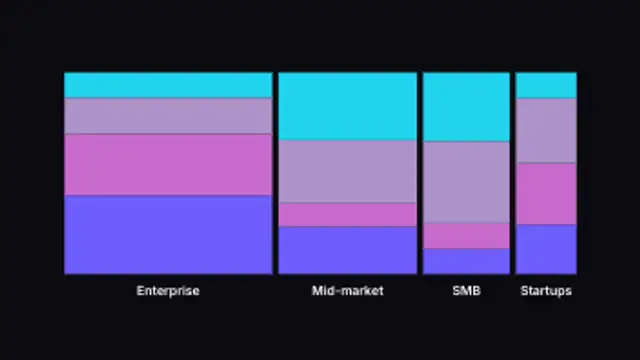
Variable-width columns rise and stack into segments, showing size and composition at once. Type your own category sizes.
Stacked Bar Chart
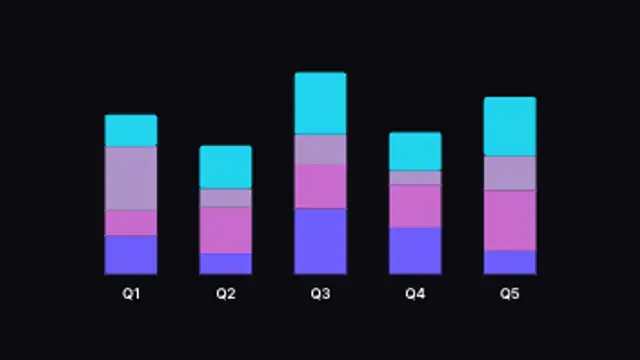
Columns fill bottom to top in stacked segments, showing composition across categories. Type your own data.
Animate a stacked bar chart where columns fill in segments to show composition across categories. Edit data and colors.
Part of Animated Infographics. New to this kind of graphic? Read How to Animate a Chart for a Video.
Transparent exports and editor imports are explained in the transparent video guide, and every download is free under the commercial license.
Content: values, labels and suffix. Typography: font. Style: background, text color, primary, secondary and accent. Layout: aspect ratio. Motion: duration, easing and variation.
Stacked Bar Chart runs 3 seconds by default, and you can set any length up to 15 seconds before you export. It plays once.
Stacked Bar Chart fits a quarterly review or a channel analytics recap when you want to show totals per period and hint at what they are made of. Columns filling in layers give a sense of composition building up, which suits a voiceover that walks through periods one at a time.
Variable-width columns rise and stack into segments, showing size and composition at once. Type your own category sizes.
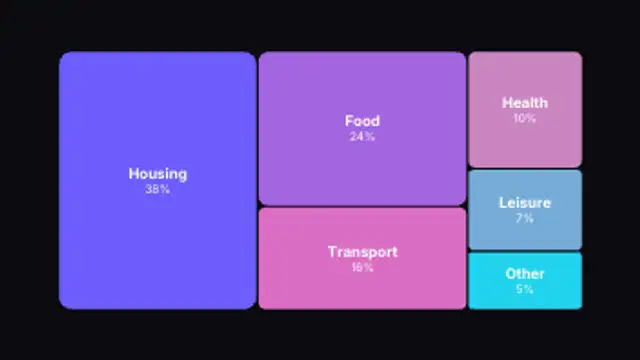
Nested rectangles sized by value tile into the frame to show part-to-whole breakdowns. Type your own data.
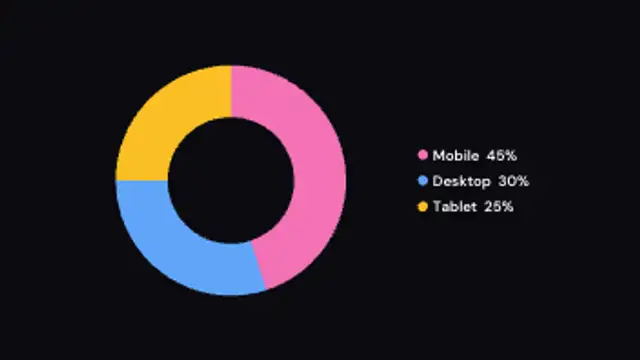
A donut chart sweeps around slice by slice while the legend fills in with computed percentages.
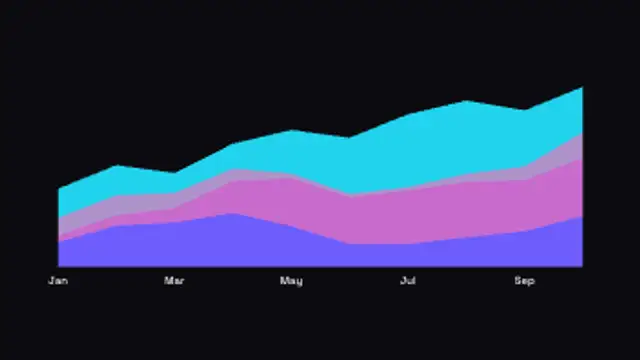
Layered bands flow across time to show composition, wiping in left to right. Type your own totals.
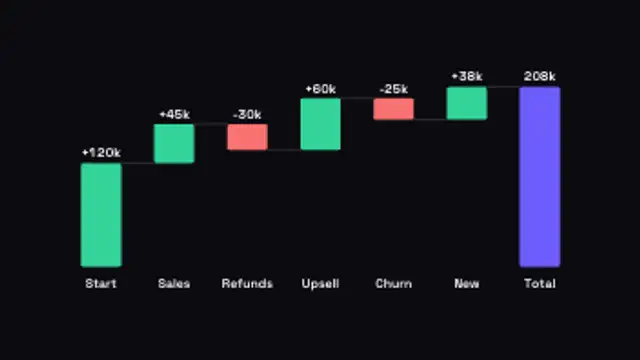
Floating bars step up and down from a running total, with connectors and a final total. Type your own +/- changes.
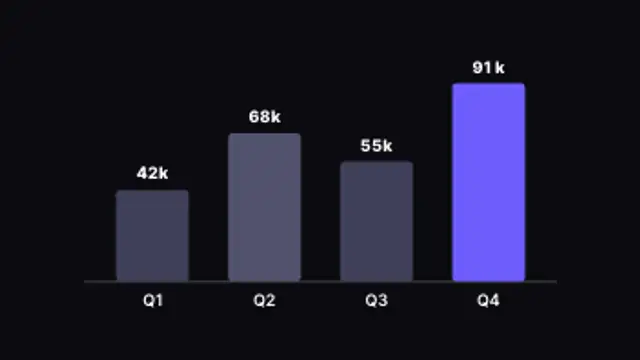
Columns rise one by one with live counting values and the top performer highlighted. Type your own data.
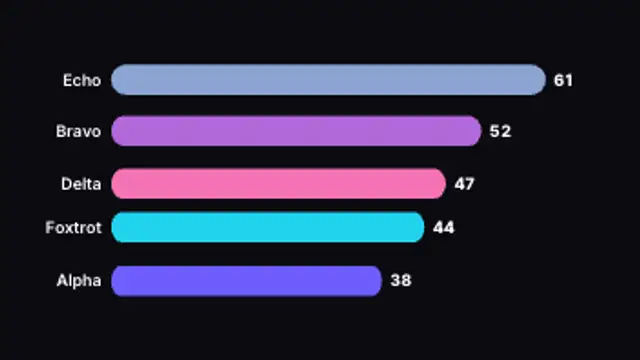
Ranked bars grow and overtake each other as the values climb, with live counting totals. Type your own data.
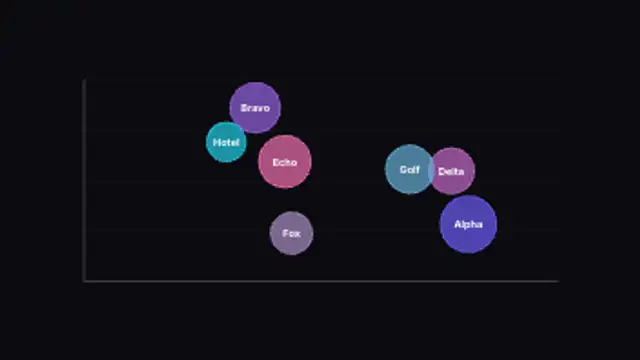
Bubbles sized by value pop onto an x/y plane for three-variable comparison. Type your own values and labels.