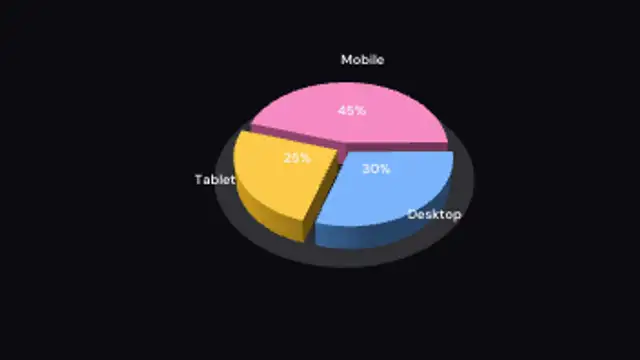
Extruded wedges sweep out one by one on a shaded floor while the camera turns slowly around the whole pie.
Pie Chart Sweep
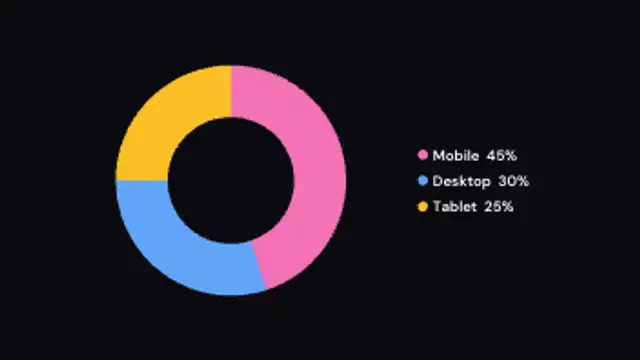
A donut chart sweeps around slice by slice while the legend fills in with computed percentages.
Part of Animated Infographics. New to this kind of graphic? Read How to Animate a Chart for a Video.
A donut chart sweeps around slice by slice while the legend fills in with computed percentages. It belongs to the Animated Infographics category on velements, where you edit it in the browser and download it as a finished video file.
Every control in the editor, grouped the same way there. Content: values, labels and suffix. Typography: font. Style: background, text color, primary, secondary and accent. Layout: aspect ratio. Motion: duration and easing. Each change appears in the live preview straight away, and editing is free.
Pie Chart Sweep runs 3 seconds by default, and you can set any length up to 15 seconds before you export. It plays once from start to finish, so it drops straight onto a cut or an opening.
Yes. Set the background to Transparent, then export a PNG sequence for Premiere Pro, After Effects, DaVinci Resolve, Final Cut Pro or Figma: import the first frame as an image sequence and it drops onto a track above your footage with a straight alpha channel. Export WebM with a VP9 alpha channel for the web and for CapCut. MP4 has no alpha channel, so it keeps a solid color or image behind the animation.
Yes. Each download comes with a perpetual commercial license in your name for client work, ads and products, and you may sell the edited clip on stock footage sites. Reselling the preset itself as an editable template is not allowed.
Extruded wedges sweep out one by one on a shaded floor while the camera turns slowly around the whole pie.
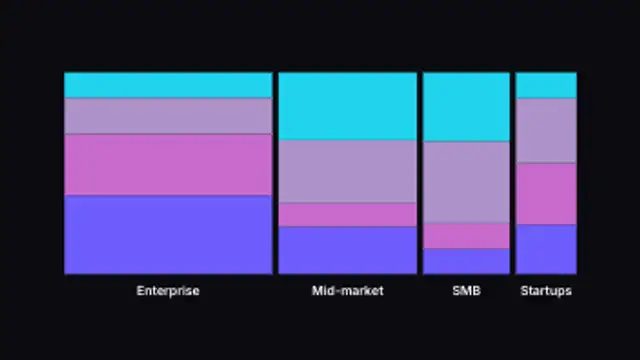
Variable-width columns rise and stack into segments, showing size and composition at once. Type your own category sizes.
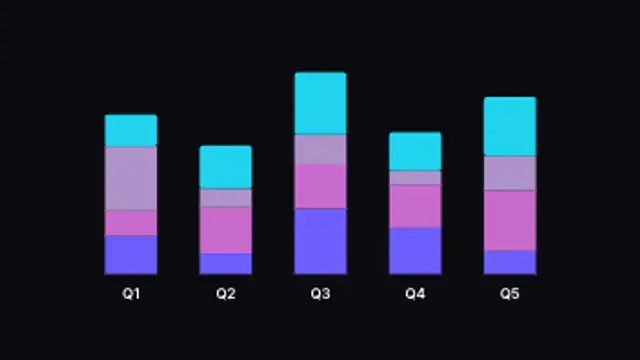
Columns fill bottom to top in stacked segments, showing composition across categories. Type your own data.
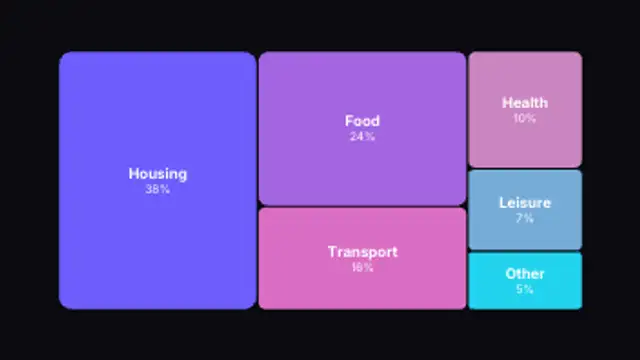
Nested rectangles sized by value tile into the frame to show part-to-whole breakdowns. Type your own data.
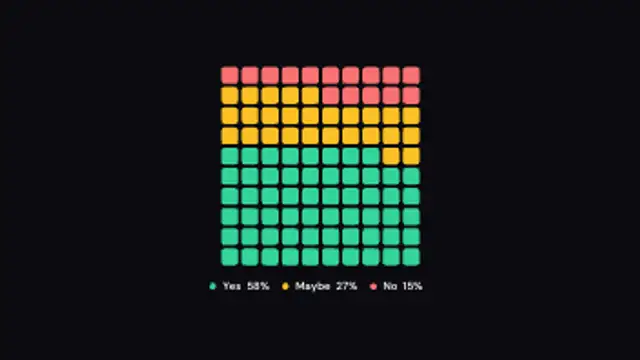
A 100-square grid fills cell by cell to show a percentage split, with a legend. Type your own category shares.
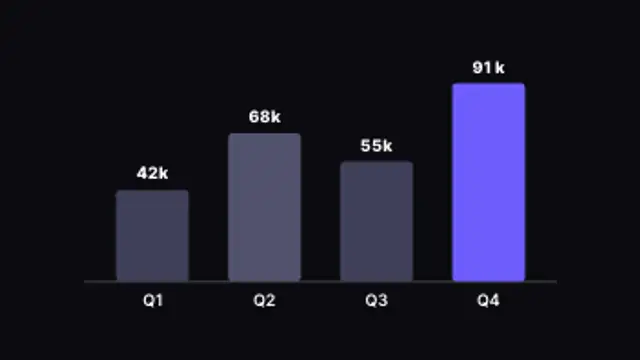
Columns rise one by one with live counting values and the top performer highlighted. Type your own data.
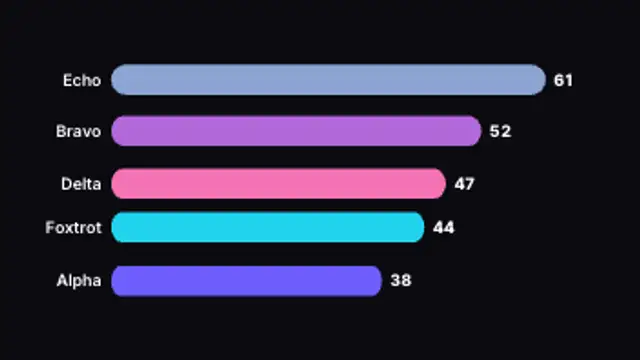
Ranked bars grow and overtake each other as the values climb, with live counting totals. Type your own data.
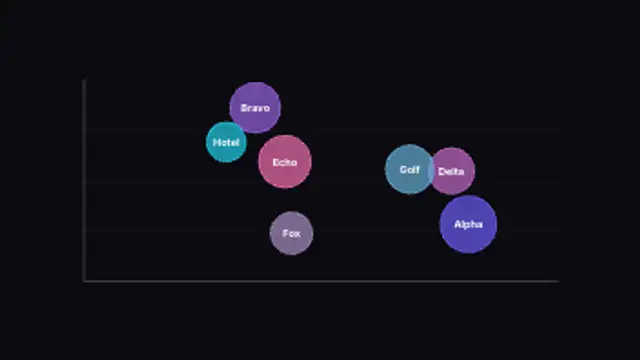
Bubbles sized by value pop onto an x/y plane for three-variable comparison. Type your own values and labels.