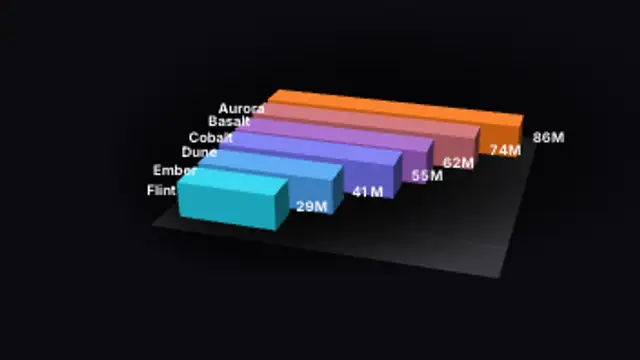
Bars race down a lane and overtake each other, swapping places smoothly as their values climb at different paces.
Bar Chart Race
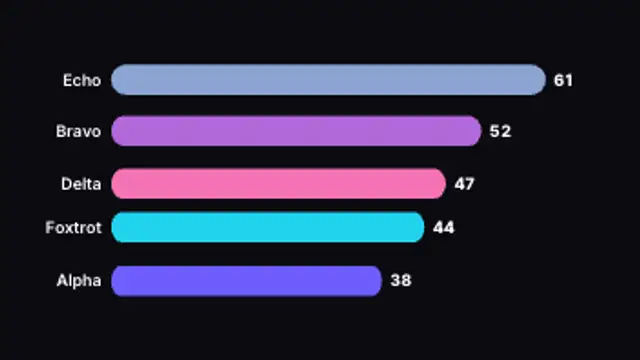
Ranked bars grow and overtake each other as the values climb, with live counting totals. Type your own data.
Make a bar chart race where ranked bars overtake each other with counting values. Edit labels, data and colors.
Part of Animated Infographics. New to this kind of graphic? Read How to Animate a Chart for a Video.
Transparent exports and editor imports are explained in the transparent video guide, and every download is free under the commercial license.
Content: values, labels and suffix. Typography: font. Style: background, text color, primary, secondary and accent. Layout: aspect ratio. Motion: duration, easing and variation.
Bar Chart Race runs 4 seconds by default, and you can set any length up to 15 seconds before you export. It plays once.
Use Bar Chart Race for the ranking moment in a year-in-review or a top five video, when you want the order to feel contested before it settles. Bars swapping places on the way to their final totals hold attention far longer than a finished leaderboard shown cold.
Bars race down a lane and overtake each other, swapping places smoothly as their values climb at different paces.
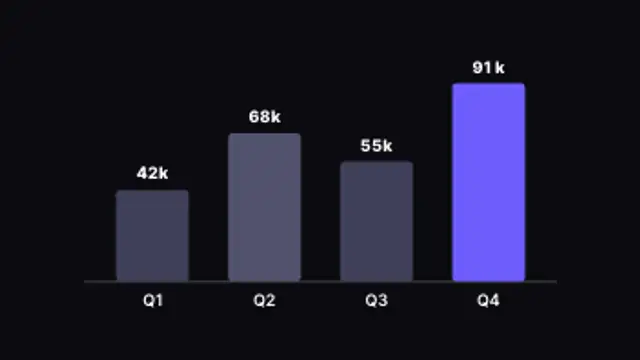
Columns rise one by one with live counting values and the top performer highlighted. Type your own data.
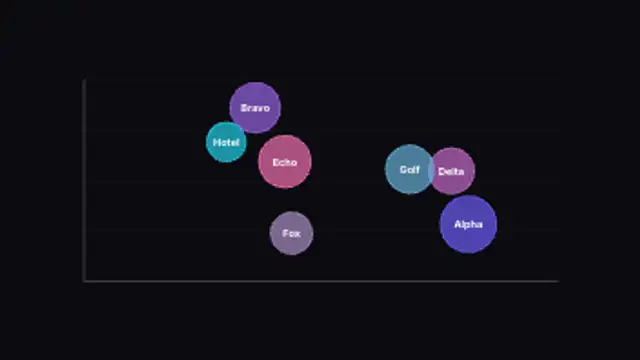
Bubbles sized by value pop onto an x/y plane for three-variable comparison. Type your own values and labels.
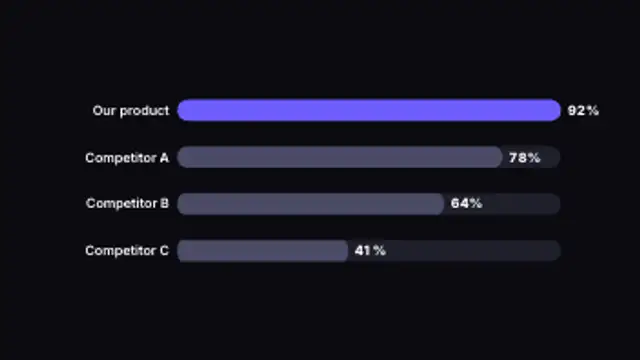
Horizontal bars race to their values side by side, making rankings and comparisons instantly clear.
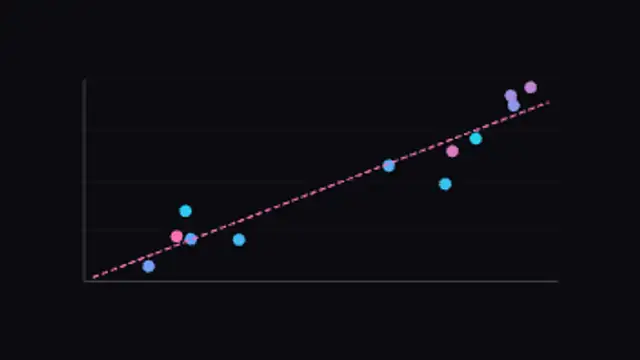
Data points pop onto an x/y plane and a dashed trend line draws through the correlation. Adjust the count and variation.
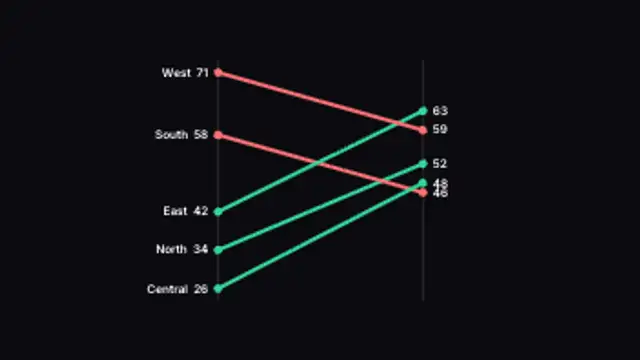
Lines tilt between a before and after axis, colored by whether each item rose or fell. Type your own paired values.
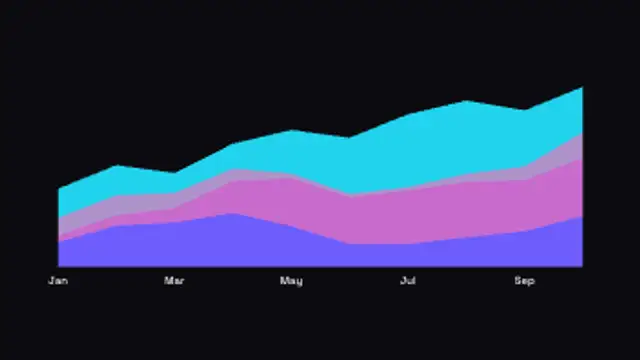
Layered bands flow across time to show composition, wiping in left to right. Type your own totals.
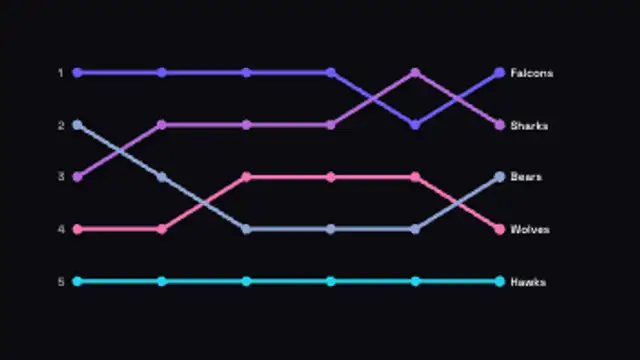
Ranked lines weave between positions over time, crossing as they overtake each other. Type your own entries.