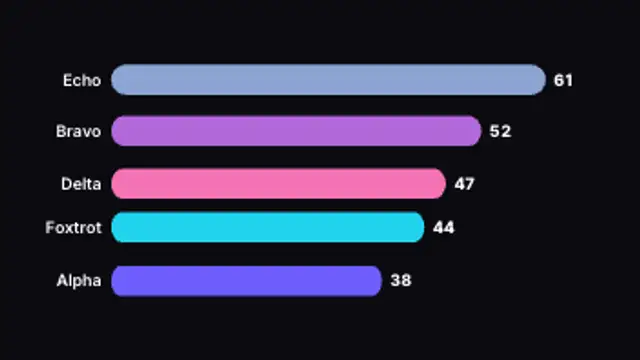
Ranked bars grow and overtake each other as the values climb, with live counting totals. Type your own data.
3D Ranked Bar Race
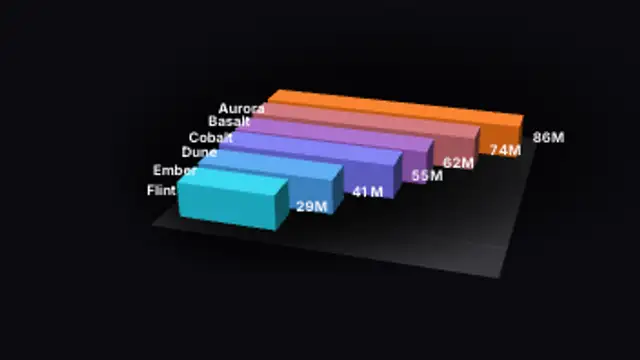
Bars race down a lane and overtake each other, swapping places smoothly as their values climb at different paces.
Race your own entries as 3D bars that reorder as they grow, with names and counting values. No scripting, no plugins.
Part of 3D Charts & Data. New to this kind of graphic? Read How to Make a 3D Animated Bar Chart for a Video.
Transparent exports and editor imports are explained in the transparent video guide, and every download is free under the commercial license.
Content: values, labels, prefix, suffix and decimals. Typography: font and weight. Style: background, text color, primary, secondary and accent. Layout: aspect ratio, camera tilt, rotation and scale. Motion: duration, easing and variation.
3D Ranked Bar Race runs 8 seconds by default, and you can set any length up to 30 seconds before you export. It plays once.
Show a ranking changing over time with 3D Ranked Bar Race: most streamed artists, top selling products, fastest growing channels. The overtakes are the story, so it suits countdown videos and year in review content where viewers root for an entry.
Ranked bars grow and overtake each other as the values climb, with live counting totals. Type your own data.
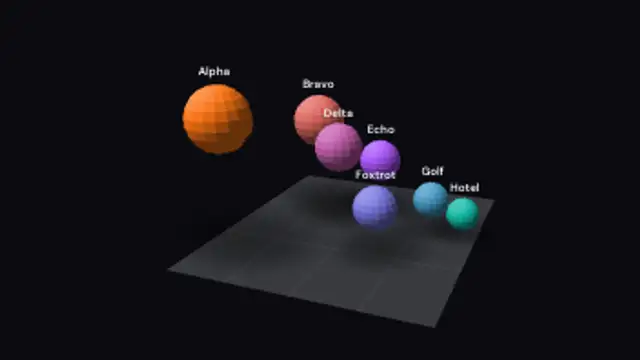
Each sphere grows to its own value so size and height both carry the number, for market maps and weighted comparisons.
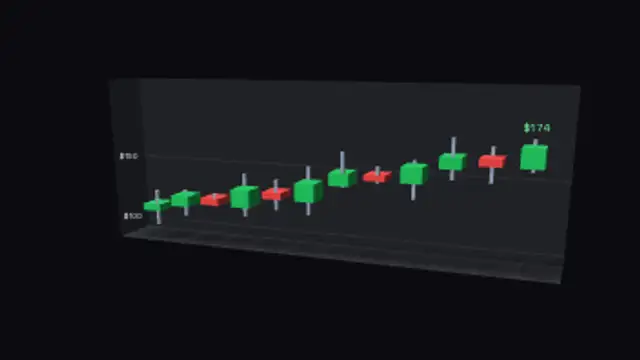
Extruded candles with wicks step across a price wall, opening at the previous close and colouring up or down.
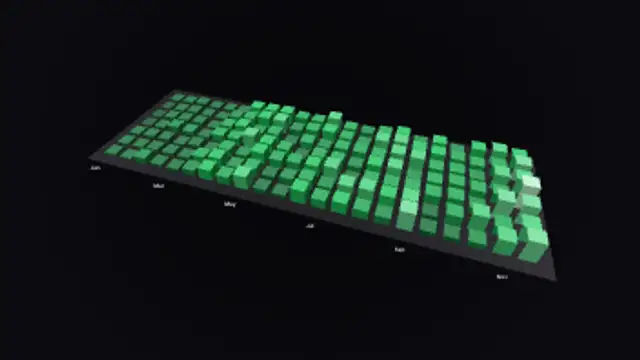
A calendar grid of small towers, taller and brighter on busy days, for streaks, activity logs and yearly recaps.
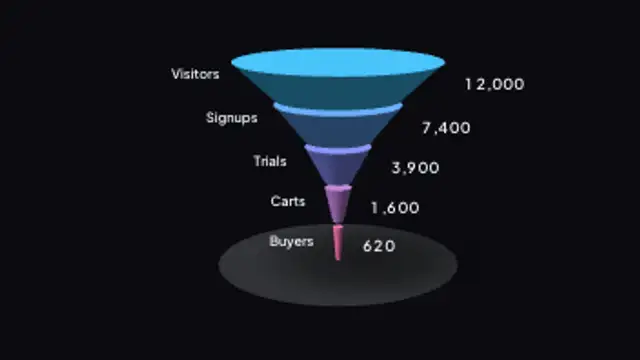
Stacked cone bands taper down from visitors to buyers, each ring sized by its own number and labelled on both sides.
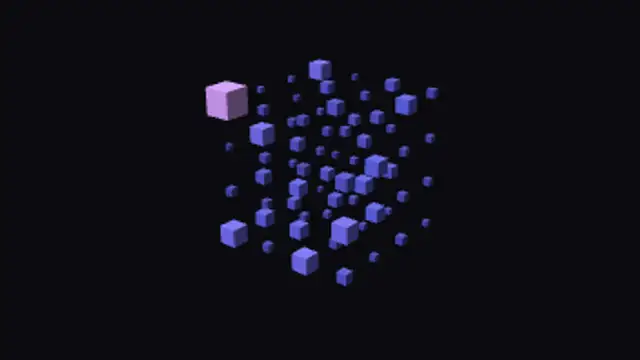
A lattice of cubes breathes in place, each one sized and coloured by its own reading, turning slowly on the spot.
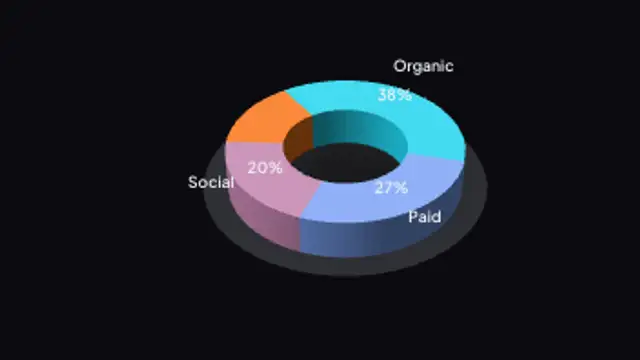
A thick donut ring builds segment by segment, tilted just enough to show its depth without hiding the far side.
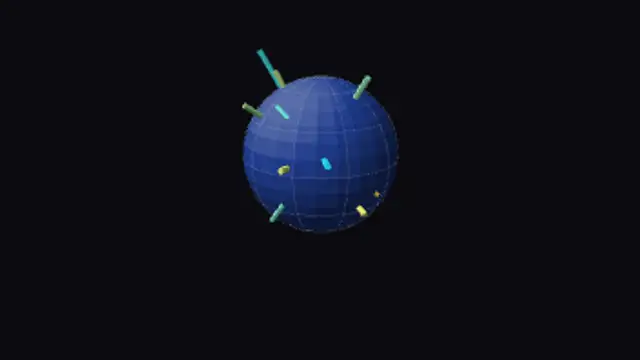
Columns stand off a slowly turning globe at their own coordinates, each one as tall as the number behind it.