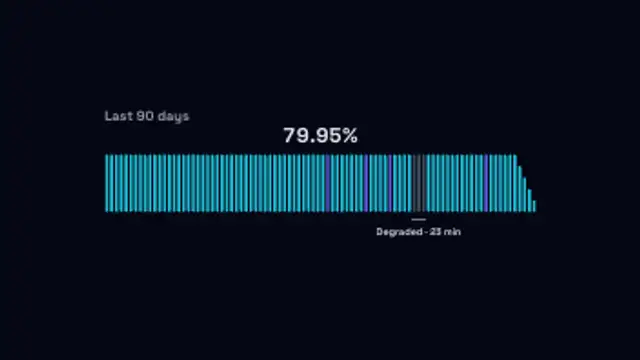
Uptime Timeline
7.5sNinety days of status bars grow in one by one, the outage days get bracketed and labelled, and the uptime figure counts up.
Anomaly Detection
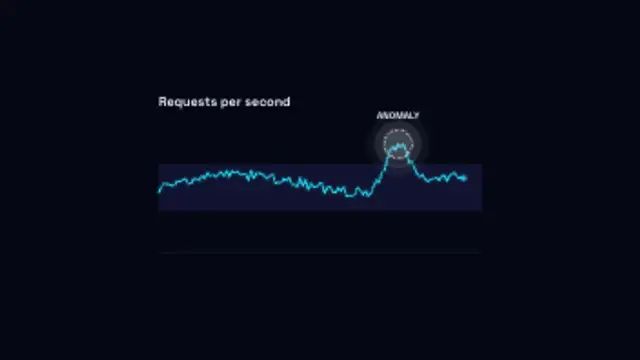
A metric traces along inside its normal band until one reading spikes clear of it and gets ringed and flagged.
Animate a live metric running inside its normal band until a spike breaks out and is flagged, for monitoring and observability videos.
Part of Networks & AI. New to this kind of graphic? Read How to Animate a Neural Network Diagram for a Video.
Transparent exports and editor imports are explained in the transparent video guide, and every download is free under the commercial license.
Content: title and subtitle. Typography: font. Style: background, text color, primary, secondary, accent and thickness. Layout: aspect ratio and scale. Motion: duration, speed and variation.
Anomaly Detection runs 7.5 seconds by default, and you can set any length up to 60 seconds before you export. It plays once.
Anomaly Detection illustrates monitoring products, fraud alerts and predictive maintenance pitches. The metric stays inside its band long enough to establish normal, so when the spike breaks out and is flagged, viewers understand what the system caught and why it mattered.
Ninety days of status bars grow in one by one, the outage days get bracketed and labelled, and the uptime figure counts up.
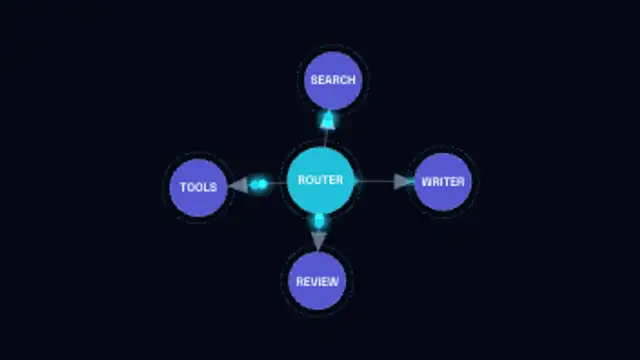
A labelled node graph builds itself edge by edge with arrowed links, then packets run the routes between agents.
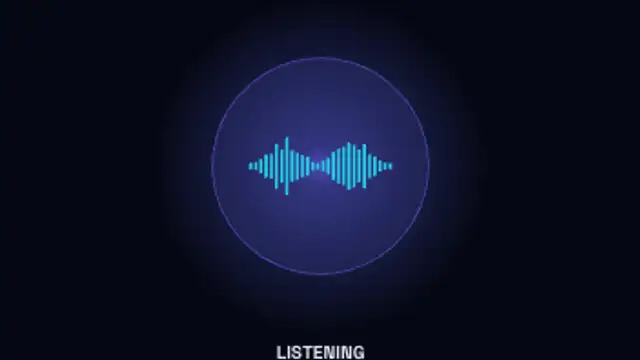
A glowing assistant orb moves through idle, listening, thinking and speaking, its waveform rising and falling with each state.
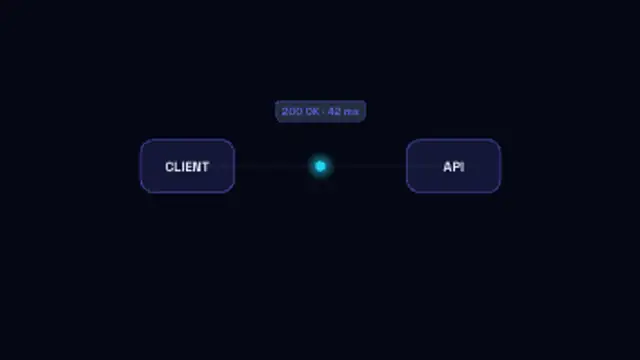
A request packet carries the endpoint across to the API, the server pulses while it works, and the response returns with its status.
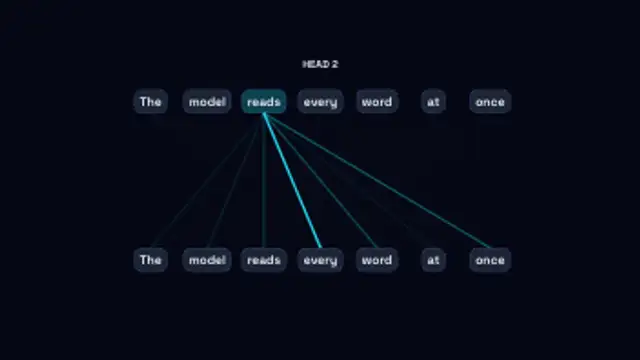
Each word in turn attends to the others, its links thickening with the weight it gives them as the heads cycle through.
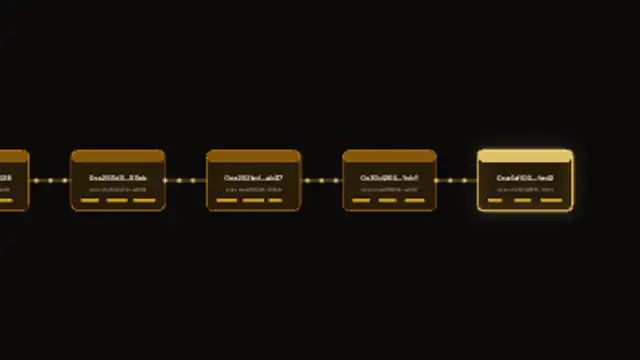
New blocks with hash labels slide in, pulse and chain onto a scrolling ledger while data flows through the links.
A generated circuit board of chips, pads and angled copper traces carries glowing data pulses from pin to pin.
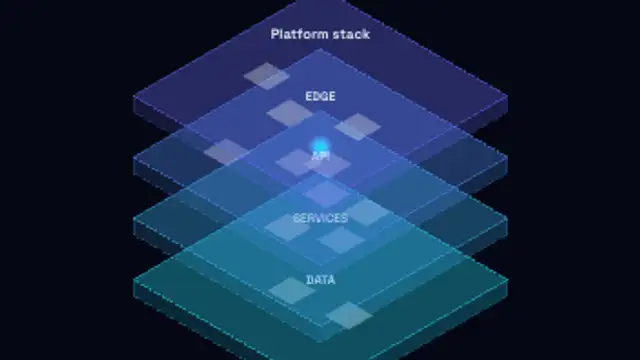
Isometric tiers drop into a stack one after another, each labelled with its layer, then a request runs down through them.