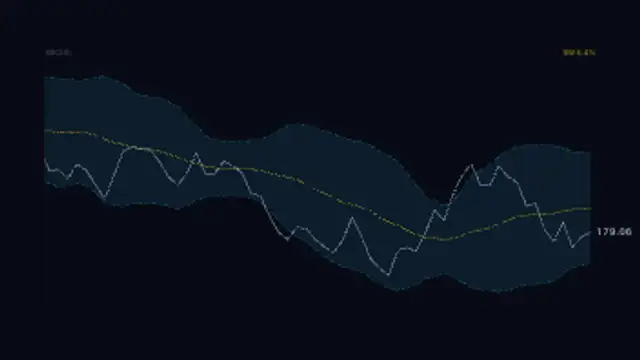
Price line weaving inside a rolling standard deviation channel with a dashed upper and lower band and a glowing middle SMA.
Trade P&L Counter
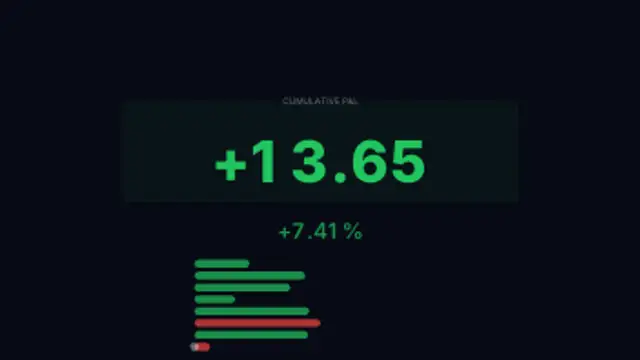
Cumulative profit and loss counter racing through a sequence of trades, flipping green to red as wins and losses stack up.
Generate a looping trading P&L counter animation showing cumulative profit and loss through a sequence of trades for trading and finance videos.
Part of Trading & Markets. New to this kind of graphic? Read How to Make a Candlestick Chart Animation.
Transparent exports and editor imports are explained in the transparent video guide, and every download is free under the commercial license.
Typography: font. Style: background, text color, primary, secondary, accent and thickness. Layout: aspect ratio and scale. Motion: duration, speed and variation.
Trade P&L Counter runs 14 seconds by default, and you can set any length up to 60 seconds before you export. It plays once.
Trade P&L Counter suits the recap section of a trading diary or a strategy backtest video, right after you finish describing the rules. The running total swinging between profit and loss shows how uneven a real equity curve feels, which a single final figure hides.
Price line weaving inside a rolling standard deviation channel with a dashed upper and lower band and a glowing middle SMA.
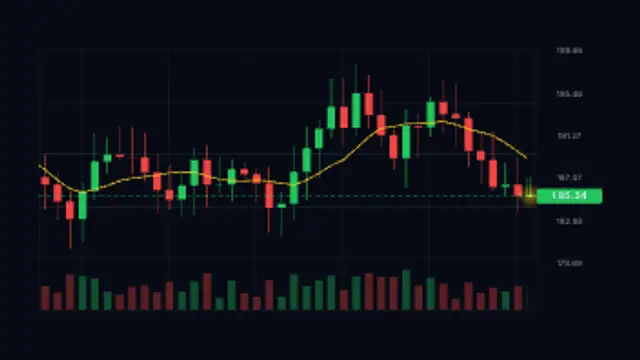
Green and red candles form live on a scrolling trading grid with a moving average and a floating price tag.
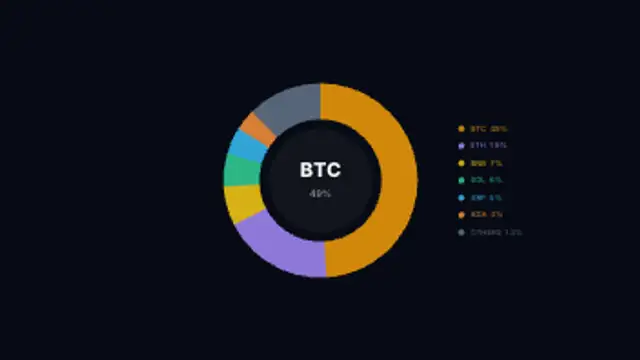
Donut chart showing Bitcoin, Ethereum, and altcoin market cap dominance shares with a live percentage counter at the center.
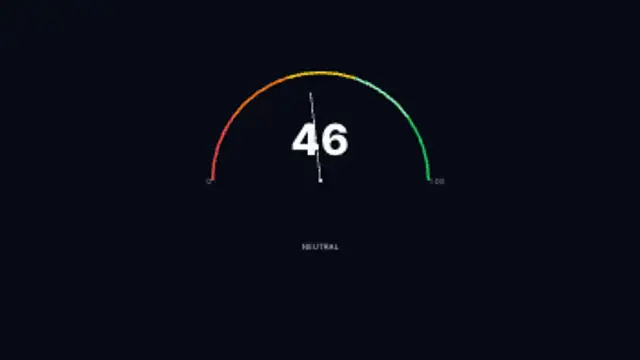
A semicircular arc gauge with a sweeping needle oscillating between Extreme Fear and Extreme Greed zones.
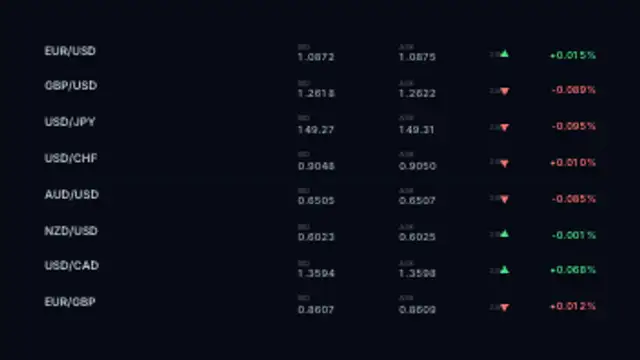
Currency pairs scrolling live bid and ask rates with 24-hour percentage changes and trend arrows on a trading terminal board.
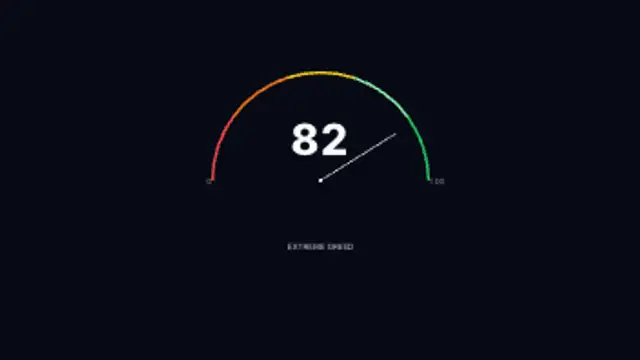
A semicircular gauge showing perpetual futures funding rate sentiment, sweeping from extreme negative to extreme positive zones.
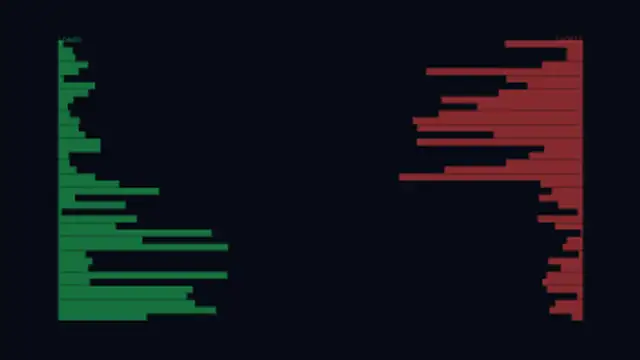
Heat-gradient bars at each price level show long and short liquidation clusters as a live price marker scrolls through them.
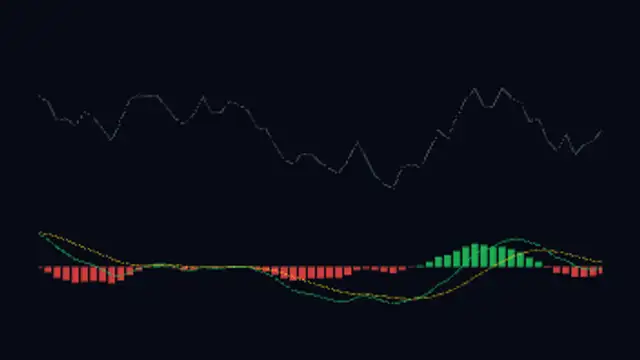
Dual-panel chart showing a scrolling price line above green and red histogram bars with MACD and signal lines crossing below.