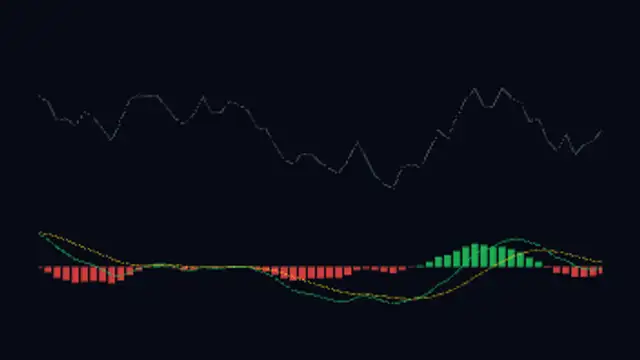
Dual-panel chart showing a scrolling price line above green and red histogram bars with MACD and signal lines crossing below.
Sector Rotation Wheel
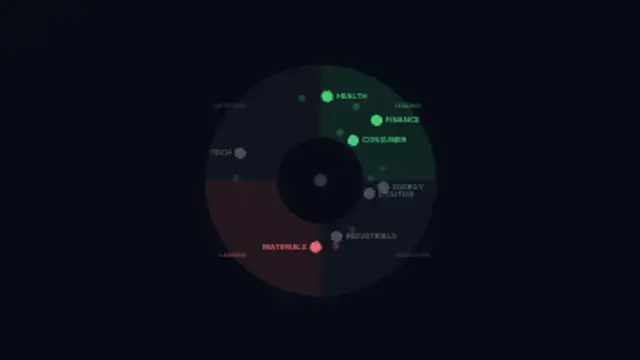
Market sectors orbit a central wheel through Leading, Weakening, Lagging, and Improving quadrants as their momentum shifts.
Generate a looping sector rotation wheel animation showing leading and lagging sectors through the market cycle for finance and trading videos.
Part of Trading & Markets. New to this kind of graphic? Read How to Make a Candlestick Chart Animation.
Transparent exports and editor imports are explained in the transparent video guide, and every download is free under the commercial license.
Typography: font. Style: background, text color, primary, secondary, accent and thickness. Layout: aspect ratio and scale. Motion: duration, speed and variation.
Sector Rotation Wheel runs 14 seconds by default, and you can set any length up to 60 seconds before you export. It plays once.
Sector Rotation Wheel belongs in a monthly outlook when you describe leadership passing from one group of stocks to another. Dots travelling through four quadrants show a cycle rather than a snapshot, so the audience understands that today's laggard may be next quarter's leader.
Dual-panel chart showing a scrolling price line above green and red histogram bars with MACD and signal lines crossing below.
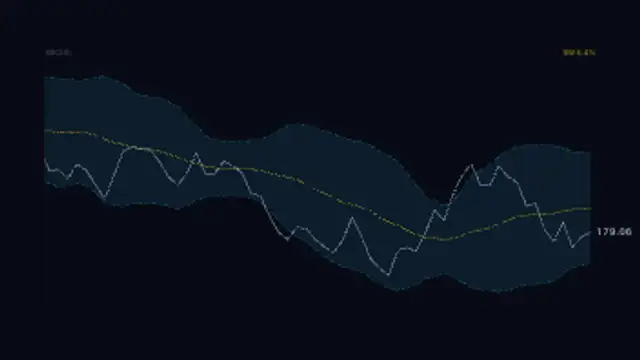
Price line weaving inside a rolling standard deviation channel with a dashed upper and lower band and a glowing middle SMA.
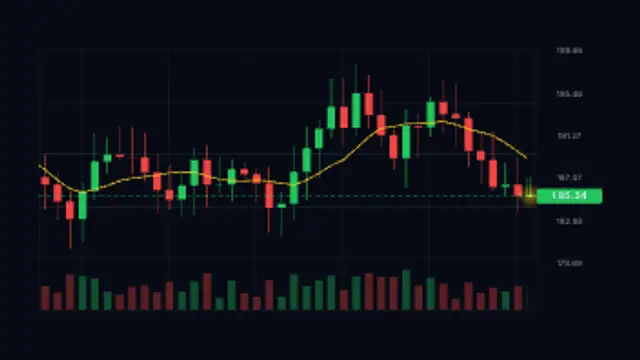
Green and red candles form live on a scrolling trading grid with a moving average and a floating price tag.
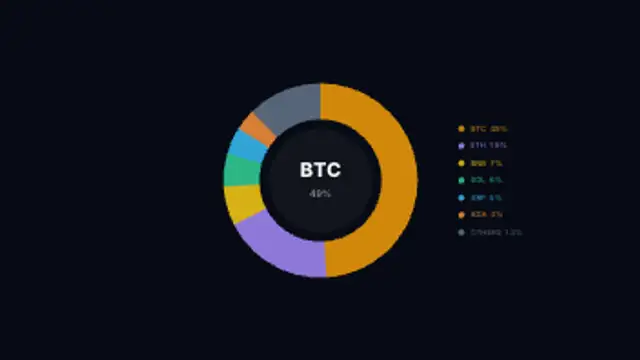
Donut chart showing Bitcoin, Ethereum, and altcoin market cap dominance shares with a live percentage counter at the center.
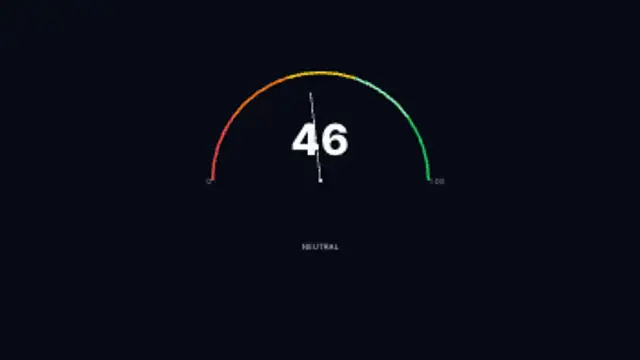
A semicircular arc gauge with a sweeping needle oscillating between Extreme Fear and Extreme Greed zones.
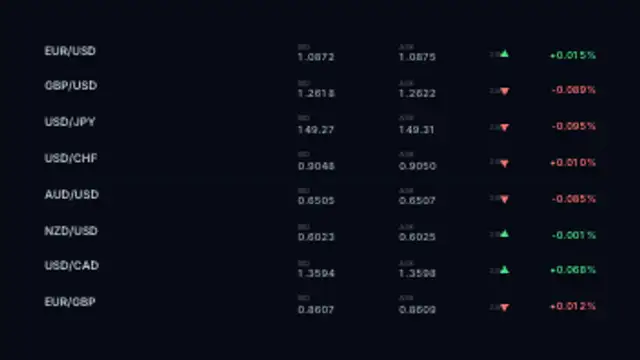
Currency pairs scrolling live bid and ask rates with 24-hour percentage changes and trend arrows on a trading terminal board.
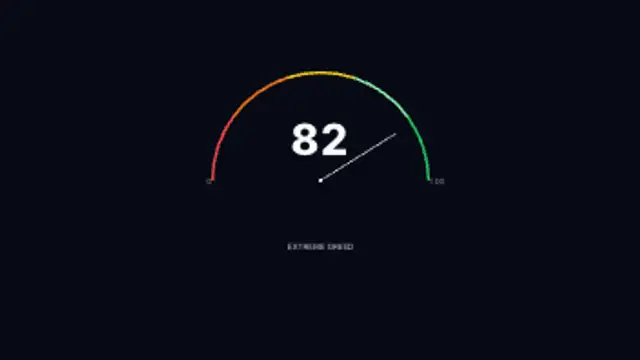
A semicircular gauge showing perpetual futures funding rate sentiment, sweeping from extreme negative to extreme positive zones.
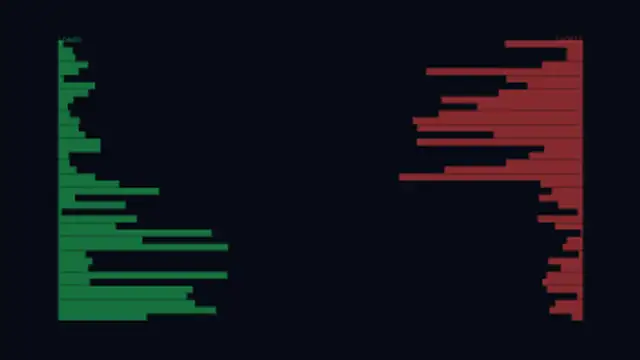
Heat-gradient bars at each price level show long and short liquidation clusters as a live price marker scrolls through them.