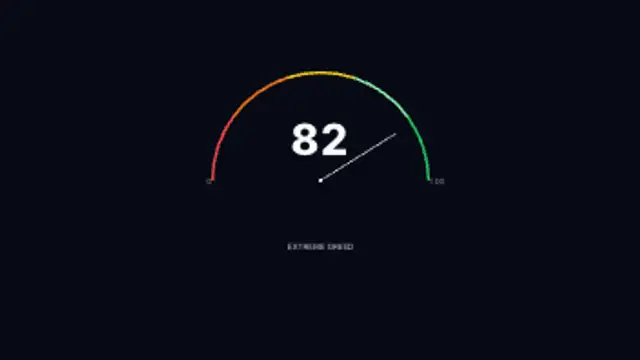
A semicircular gauge showing perpetual futures funding rate sentiment, sweeping from extreme negative to extreme positive zones.
Open Interest Chart
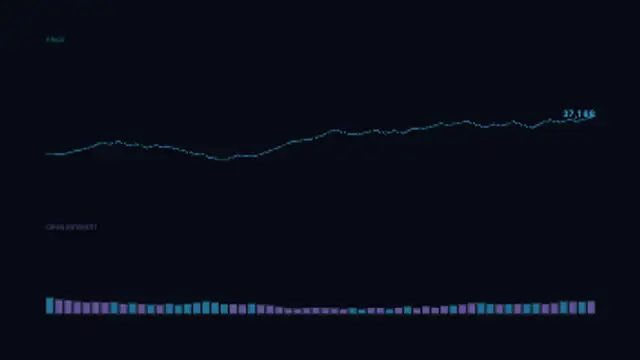
Price line on the upper axis and open interest bars below scrolling together, revealing how positioning builds as price moves.
Generate a looping open interest chart with price line and OI bars showing derivatives positioning for crypto trading and finance videos.
Part of Trading & Markets. New to this kind of graphic? Read How to Make a Candlestick Chart Animation.
Transparent exports and editor imports are explained in the transparent video guide, and every download is free under the commercial license.
Typography: font. Style: background, text color, primary, secondary, accent and thickness. Layout: aspect ratio and scale. Motion: duration, speed and variation.
Open Interest Chart runs 16 seconds by default, and you can set any length up to 60 seconds before you export. It plays once.
Bring in Open Interest Chart when you explain whether a price move was backed by new positions or just short covering. Price above and bars below scroll in step, so viewers can compare the two panels at the same instant instead of flipping between tabs.
A semicircular gauge showing perpetual futures funding rate sentiment, sweeping from extreme negative to extreme positive zones.
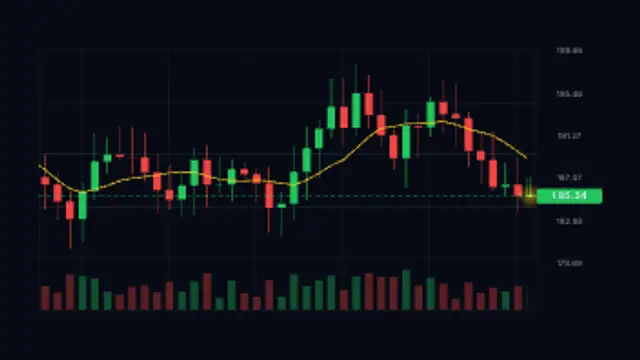
Green and red candles form live on a scrolling trading grid with a moving average and a floating price tag.
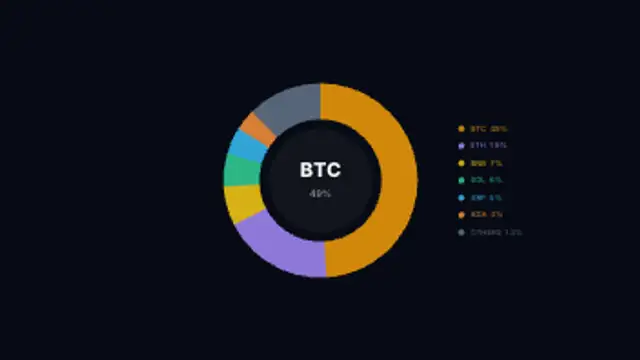
Donut chart showing Bitcoin, Ethereum, and altcoin market cap dominance shares with a live percentage counter at the center.
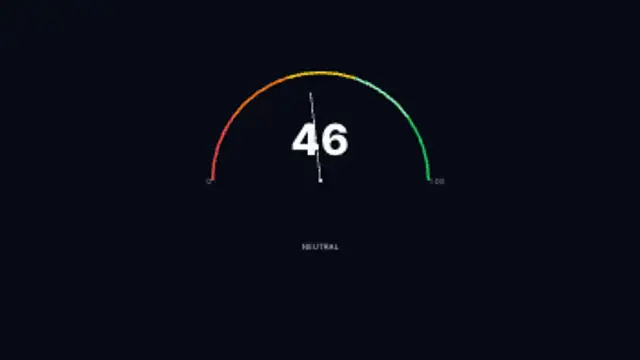
A semicircular arc gauge with a sweeping needle oscillating between Extreme Fear and Extreme Greed zones.
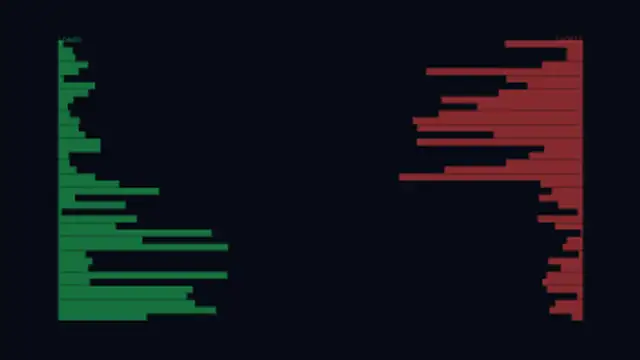
Heat-gradient bars at each price level show long and short liquidation clusters as a live price marker scrolls through them.
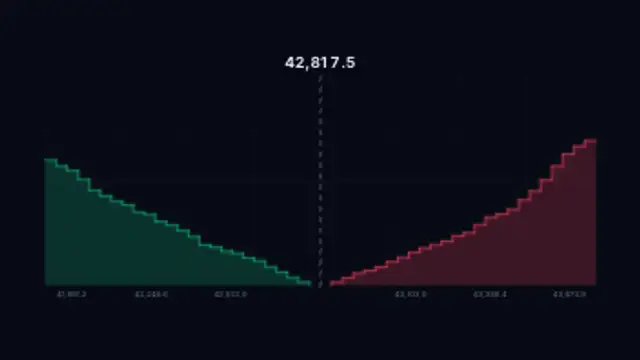
Stepped bid and ask depth walls breathe on either side of a glowing mid price, straight from an exchange screen.
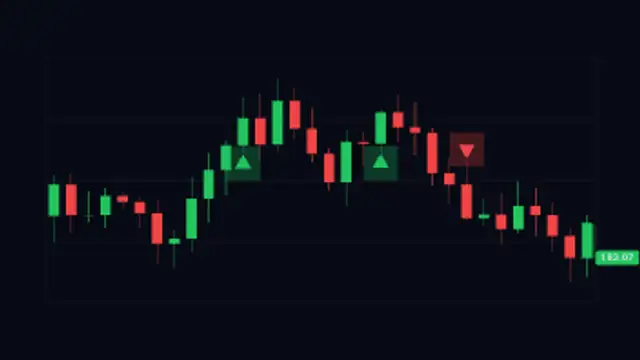
Candlestick chart with animated buy and sell arrow signals popping in at key candles as price scrolls across the screen.
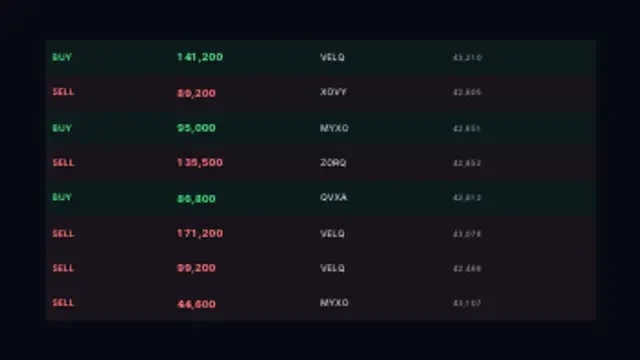
Scrolling transaction tape of large market orders with highlighted whale trades flashing buy and sell amounts in real time.