
3D Value Pyramid
4.5sA stepped pyramid builds tier by tier from a broad base to a narrow peak, for hierarchies, priorities and maturity models.
Value Pyramid Tiers
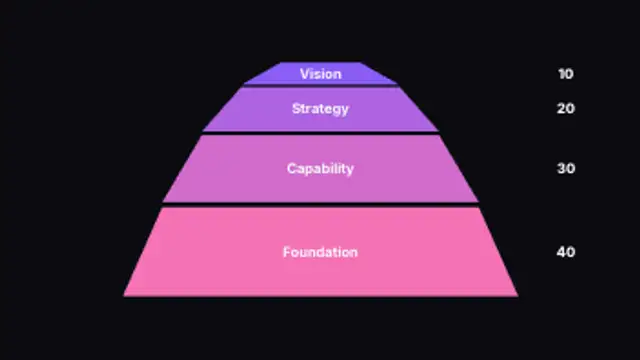
Tiers stack into a pyramid with each band's depth set by its own number, so the base carries real weight instead of being drawn equal.
Stack a pyramid whose tiers are sized by your own values rather than drawn equal. Edit tiers, numbers, colours and pacing.
Part of Diagrams & Process. New to this kind of graphic? Read How to Make an Animated Flowchart or Org Chart Video.
Transparent exports and editor imports are explained in the transparent video guide, and every download is free under the commercial license.
Content: title, labels, values and suffix. Typography: font, weight and size. Style: background, text color, primary, secondary, accent and thickness. Layout: aspect ratio and corner radius. Motion: duration and easing.
Value Pyramid Tiers runs 5 seconds by default, and you can set any length up to 30 seconds before you export. It plays once.
Value Pyramid Tiers suits a talk about foundations and priorities, a nutrition guide, or a breakdown of customer tiers by size. Since each band is as deep as its number, the pyramid shows real proportions instead of a decorative triangle.
A stepped pyramid builds tier by tier from a broad base to a narrow peak, for hierarchies, priorities and maturity models.
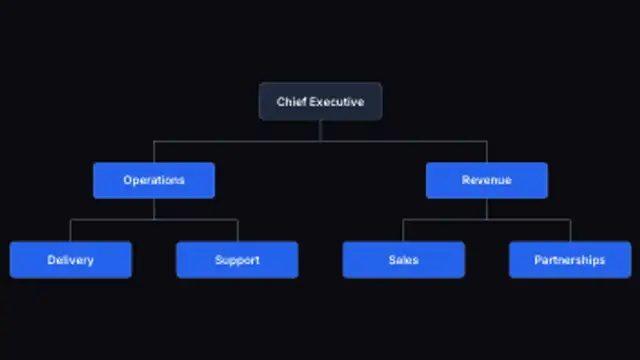
Type the names and the chart solves its own shape: every parent centres over its children and the connectors redraw to match.
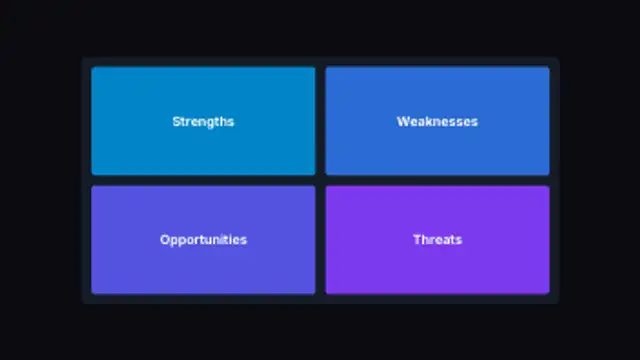
Four quadrants fill in turn on a single board, each panel sizing itself to the grid rather than to a fixed template.
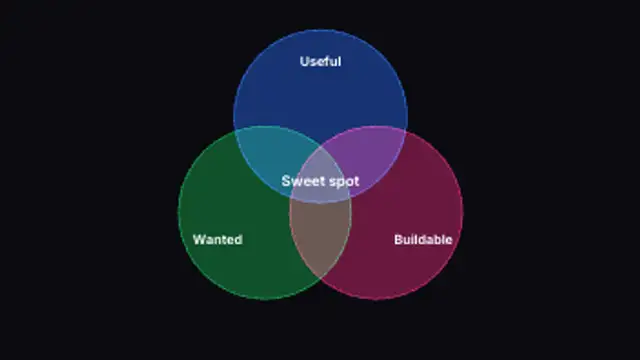
Sets travel in from apart and settle into a true overlap, the shared region brightening where the circles actually intersect.
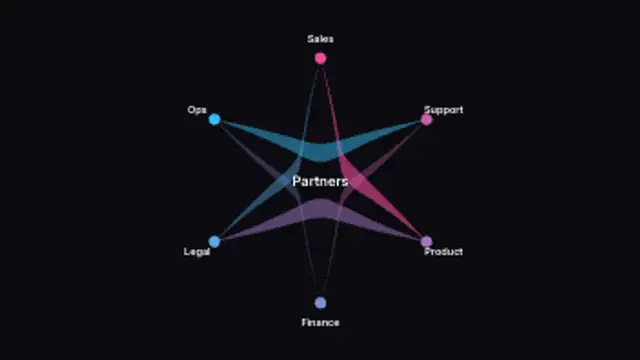
Parties sit around a circle and curved bands link them, each band widening with the weight of the relationship it carries.
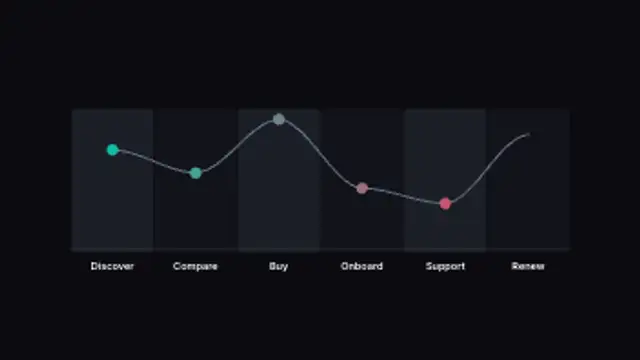
Stages divide the frame into columns and a sentiment line rides across them, rising and dipping to the scores you set per stage.
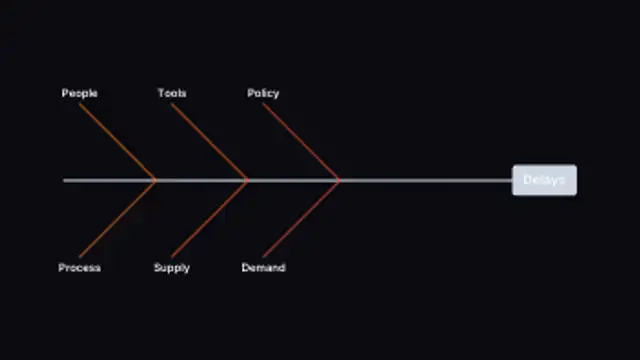
Causes angle off a central spine toward the problem at the head, and the bones respace themselves however many causes you list.
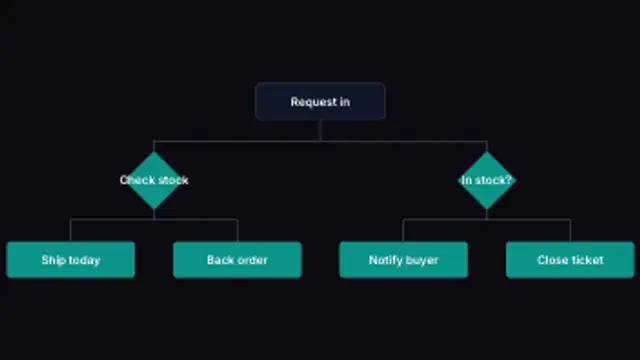
A process branches down the frame, turning every branching step into a decision diamond and routing each connector around it.