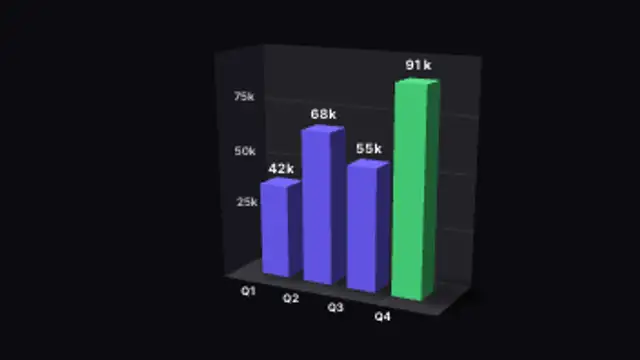
Extruded columns rise from a shadowed floor against a gridded back wall, counting up to your values as they land.
3D Stacked Bars
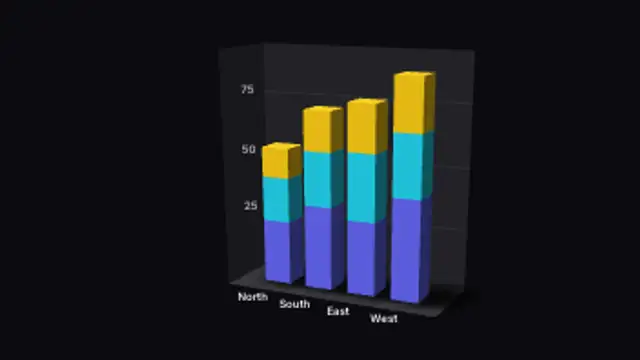
Segments stack on top of each other inside each column, each one shaded separately so the split stays readable in perspective.
Show a composition as stacked 3D bars that build segment by segment with real shading and shadows. Edit values, labels and colors.
Part of 3D Charts & Data. New to this kind of graphic? Read How to Make a 3D Animated Bar Chart for a Video.
Transparent exports and editor imports are explained in the transparent video guide, and every download is free under the commercial license.
Content: values, labels, prefix, suffix and decimals. Typography: font and weight. Style: background, text color, primary, secondary and accent. Layout: aspect ratio, camera tilt, rotation and scale. Motion: duration and easing.
3D Stacked Bars runs 4.5 seconds by default, and you can set any length up to 30 seconds before you export. It plays once.
Use 3D Stacked Bars when the total and its make-up both matter: revenue by product line per region, traffic by source per month, budget by department. Each column shows the whole, and the separately shaded segments show what it is made of.
Extruded columns rise from a shadowed floor against a gridded back wall, counting up to your values as they land.
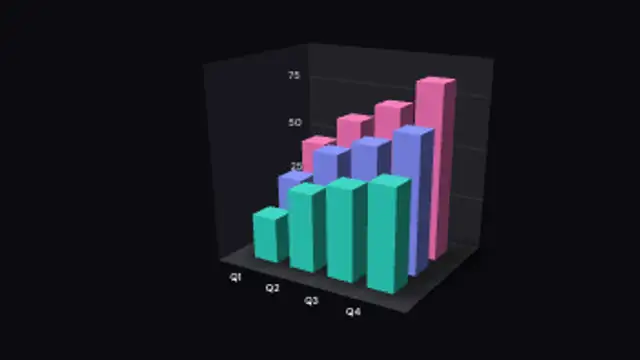
Two or three series sit in rows receding into depth, so near bars overlap far ones the way a real chart on a desk would.
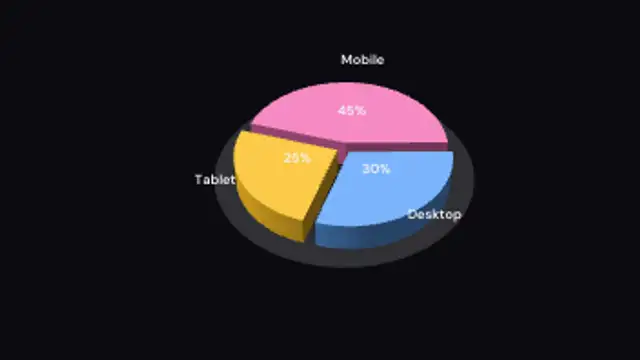
Extruded wedges sweep out one by one on a shaded floor while the camera turns slowly around the whole pie.
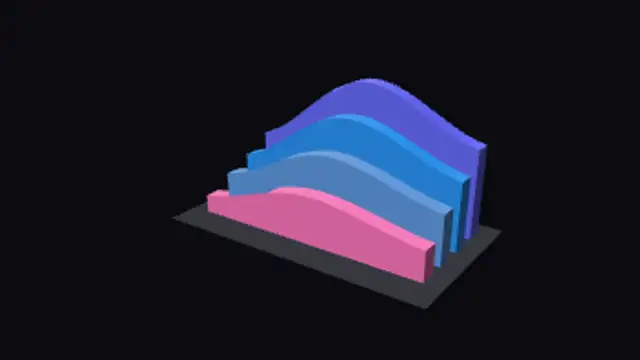
Four filled areas recede like a range of ridges, a dense data backdrop rather than a chart read value by value.
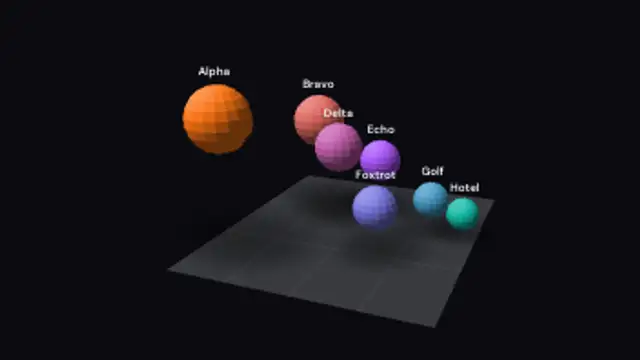
Each sphere grows to its own value so size and height both carry the number, for market maps and weighted comparisons.
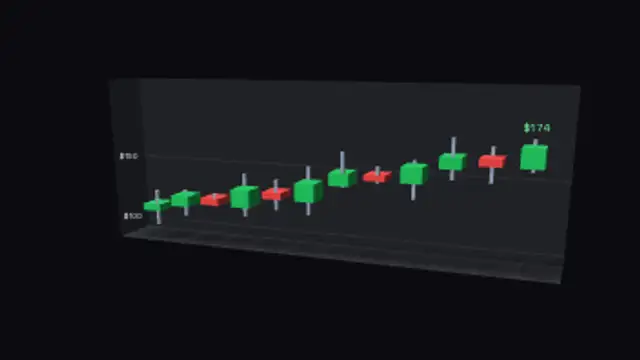
Extruded candles with wicks step across a price wall, opening at the previous close and colouring up or down.
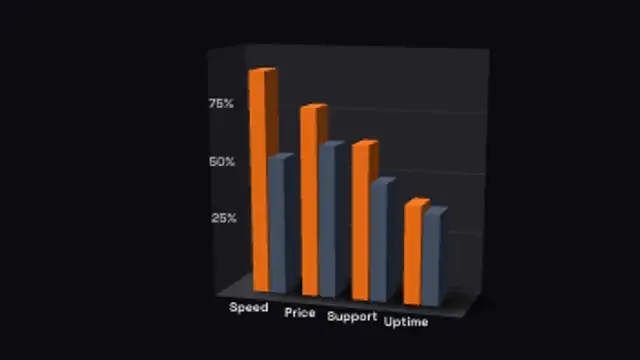
Pairs of bars stand side by side in each slot, built for head-to-head product, team or before-and-after comparisons.
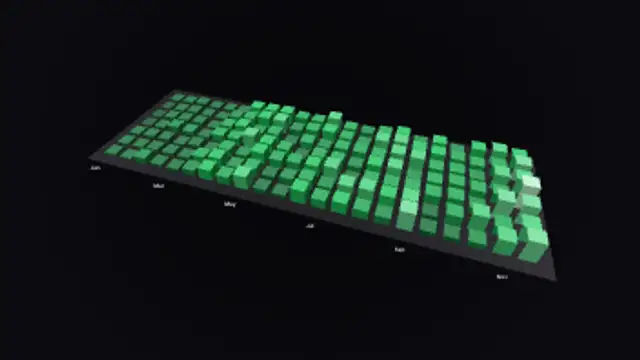
A calendar grid of small towers, taller and brighter on busy days, for streaks, activity logs and yearly recaps.