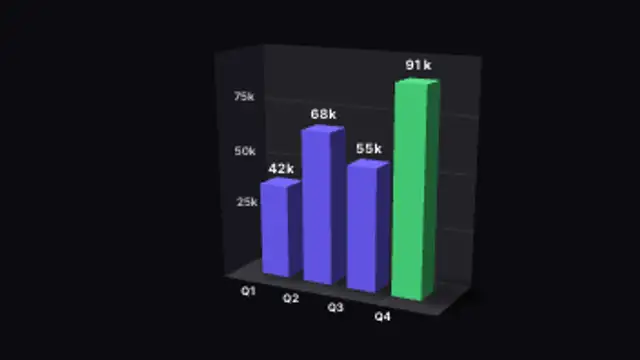
Extruded columns rise from a shadowed floor against a gridded back wall, counting up to your values as they land.
3D Area Mountain Range
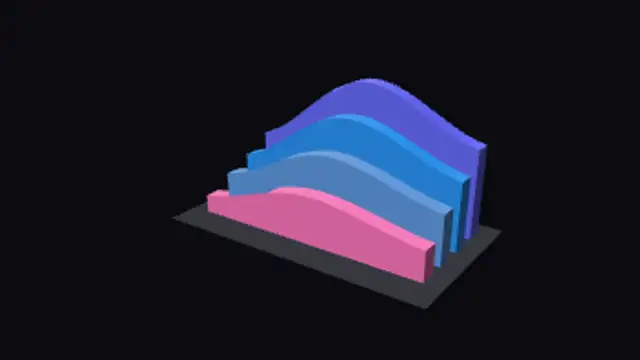
Four filled areas recede like a range of ridges, a dense data backdrop rather than a chart read value by value.
Four extruded area curves build into a receding ridge line for tech, finance and science backdrops. Edit every point and color.
Part of 3D Charts & Data. New to this kind of graphic? Read How to Make a 3D Animated Bar Chart for a Video.
Transparent exports and editor imports are explained in the transparent video guide, and every download is free under the commercial license.
Content: values, labels, prefix, suffix and decimals. Typography: font and weight. Style: background, text color, primary, secondary and accent. Layout: aspect ratio, camera tilt, rotation and scale. Motion: duration and easing.
3D Area Mountain Range runs 6 seconds by default, and you can set any length up to 30 seconds before you export. It plays once.
Use 3D Area Mountain Range as a data-flavored backdrop for a tech keynote opener, an analytics product hero or a section title in a report video. Four ridges fading into depth suggest volume and history without a single axis label to read.
Extruded columns rise from a shadowed floor against a gridded back wall, counting up to your values as they land.
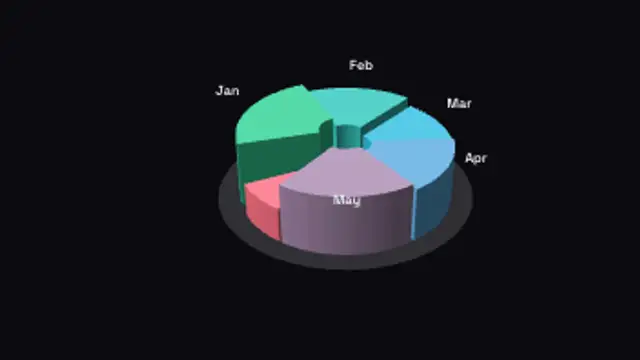
Each wedge keeps an equal slice of the circle but rises to its own value, so the reading is height instead of angle.
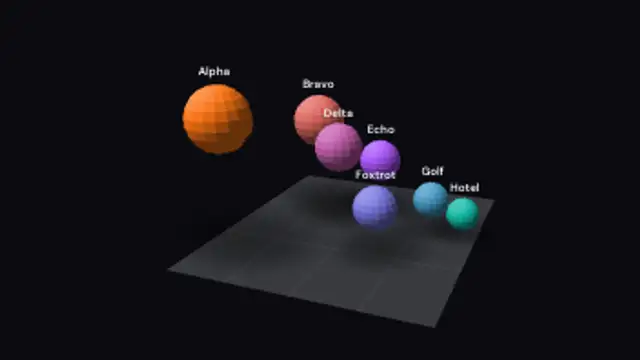
Each sphere grows to its own value so size and height both carry the number, for market maps and weighted comparisons.
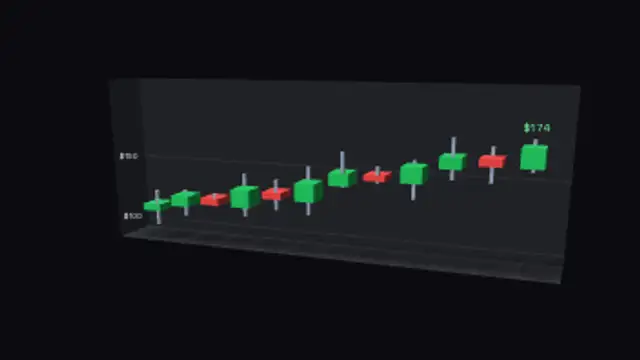
Extruded candles with wicks step across a price wall, opening at the previous close and colouring up or down.
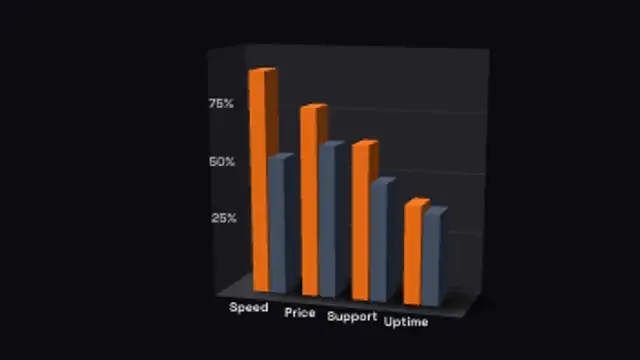
Pairs of bars stand side by side in each slot, built for head-to-head product, team or before-and-after comparisons.
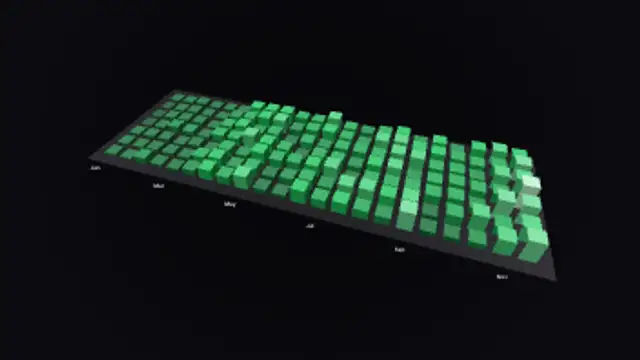
A calendar grid of small towers, taller and brighter on busy days, for streaks, activity logs and yearly recaps.
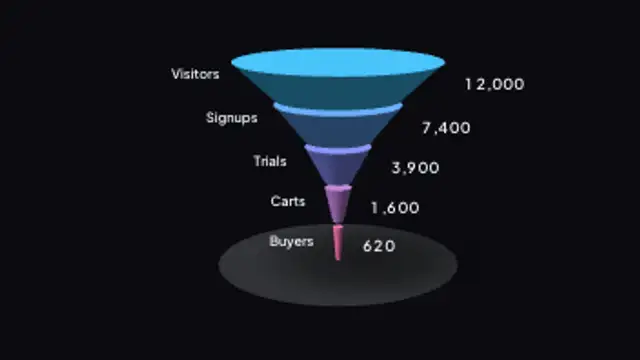
Stacked cone bands taper down from visitors to buyers, each ring sized by its own number and labelled on both sides.
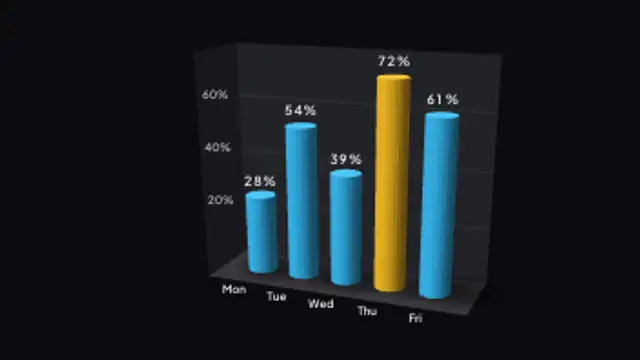
Rounded cylinder bars with smooth radial shading step up one by one, a softer alternative to hard-edged columns.