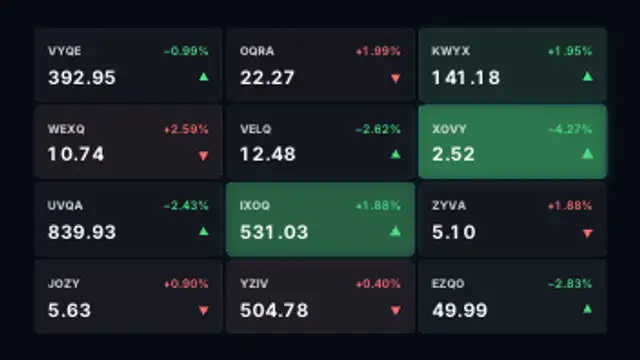
A watchlist grid of fictional symbols ticks through live prices with green and red flashes and direction arrows.
Market Heatmap
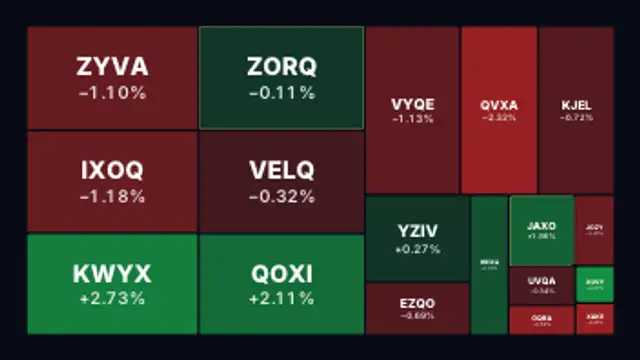
Treemap tiles of fictional stocks shift between green and red intensities with live percentage moves across the board.
Part of Trading & Markets. New to this kind of graphic? Read How to Make a Candlestick Chart Animation.
Treemap tiles of fictional stocks shift between green and red intensities with live percentage moves across the board. It belongs to the Trading & Markets category on velements, where you edit it in the browser and download it as a finished video file.
Every control in the editor, grouped the same way there. Typography: font. Style: background, text color, primary, secondary, accent and thickness. Layout: aspect ratio and scale. Motion: duration, speed and variation. Each change appears in the live preview straight away, and editing is free.
Market Heatmap runs 15 seconds by default, and you can set any length up to 60 seconds before you export. It plays once from start to finish, so it drops straight onto a cut or an opening.
Yes. Set the background to Transparent, then export a PNG sequence for Premiere Pro, After Effects, DaVinci Resolve, Final Cut Pro or Figma: import the first frame as an image sequence and it drops onto a track above your footage with a straight alpha channel. Export WebM with a VP9 alpha channel for the web and for CapCut. MP4 has no alpha channel, so it keeps a solid color or image behind the animation.
Yes. Each download comes with a perpetual commercial license in your name for client work, ads and products, and you may sell the edited clip on stock footage sites. Reselling the preset itself as an editable template is not allowed.
A watchlist grid of fictional symbols ticks through live prices with green and red flashes and direction arrows.
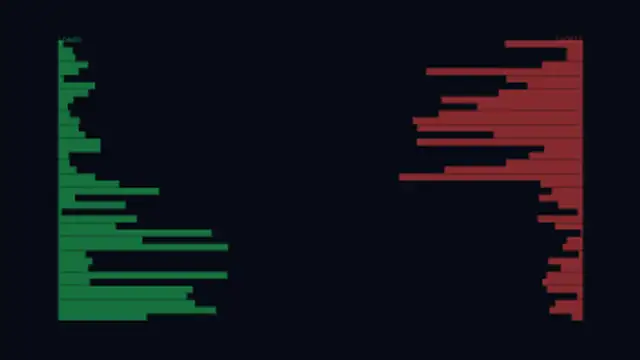
Heat-gradient bars at each price level show long and short liquidation clusters as a live price marker scrolls through them.
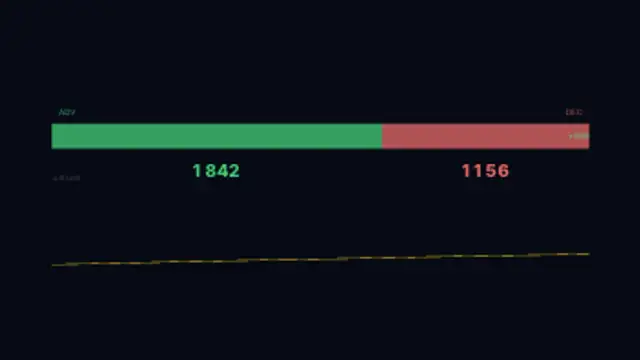
Stacked bar shows advancing versus declining stocks with a scrolling advance-decline cumulative index line below.
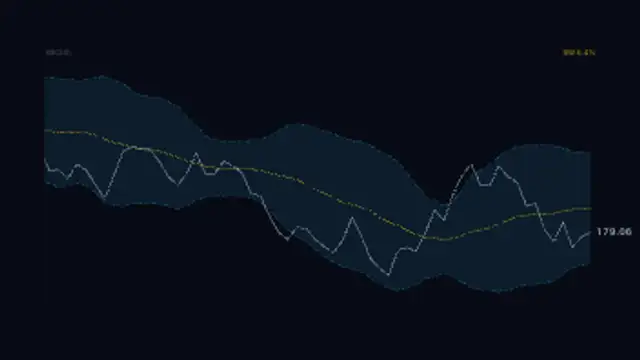
Price line weaving inside a rolling standard deviation channel with a dashed upper and lower band and a glowing middle SMA.
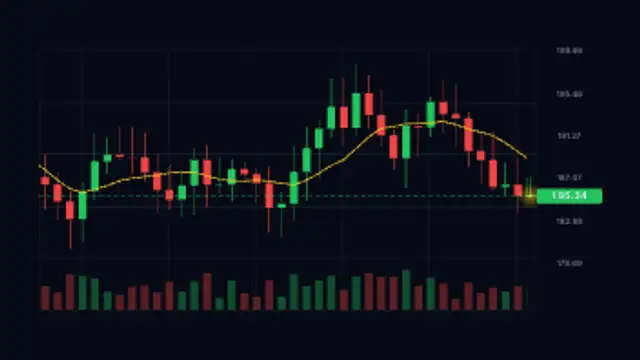
Green and red candles form live on a scrolling trading grid with a moving average and a floating price tag.
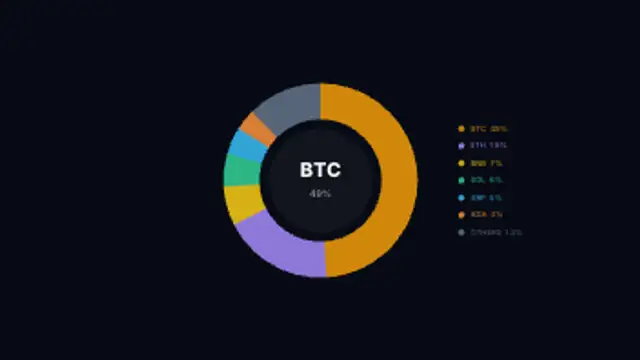
Donut chart showing Bitcoin, Ethereum, and altcoin market cap dominance shares with a live percentage counter at the center.
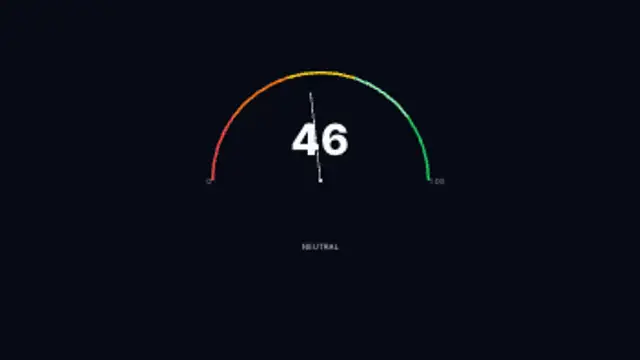
A semicircular arc gauge with a sweeping needle oscillating between Extreme Fear and Extreme Greed zones.
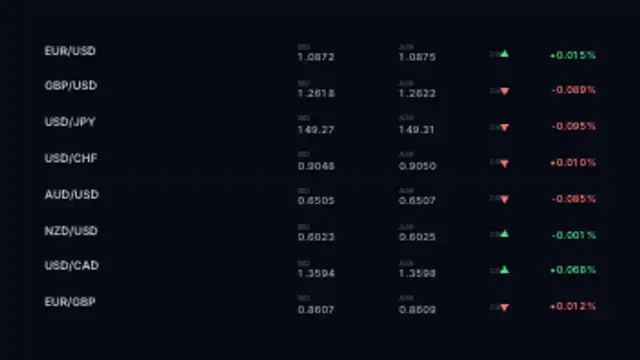
Currency pairs scrolling live bid and ask rates with 24-hour percentage changes and trend arrows on a trading terminal board.