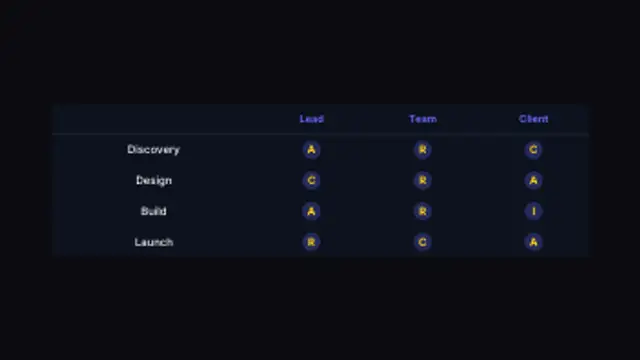
Rows and columns size themselves to whatever tasks and roles you type, and each cell carries its own responsibility letter.
Gantt Timeline Build
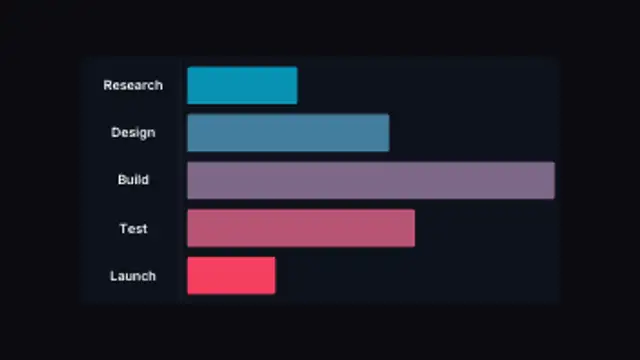
Task bars grow from a shared start line to lengths set by your own numbers, so the schedule draws itself from the data.
Grow Gantt task bars from a shared start line to lengths driven by your own values. Edit tasks, durations, colours and pacing.
Part of Diagrams & Process. New to this kind of graphic? Read How to Make an Animated Flowchart or Org Chart Video.
Transparent exports and editor imports are explained in the transparent video guide, and every download is free under the commercial license.
Content: title, labels, values and suffix. Typography: font, weight and size. Style: background, text color, primary, secondary, accent and thickness. Layout: aspect ratio and corner radius. Motion: duration and easing.
Gantt Timeline Build runs 6 seconds by default, and you can set any length up to 30 seconds before you export. It plays once.
Use Gantt Timeline Build in a project kickoff video or a client proposal to show how long each task runs. Bars growing from a common start line make the longest task obvious before anyone reads a number.
Rows and columns size themselves to whatever tasks and roles you type, and each cell carries its own responsibility letter.
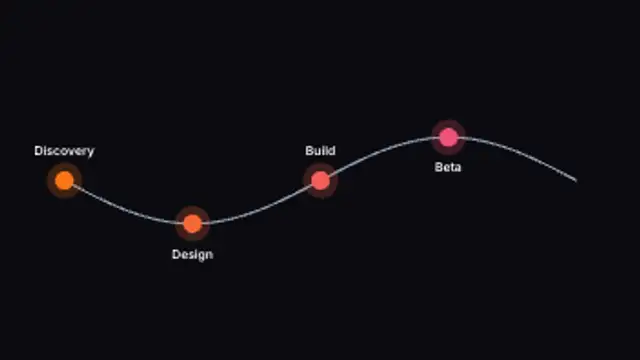
A winding track draws itself across the frame and each milestone pops the moment the line actually reaches it.
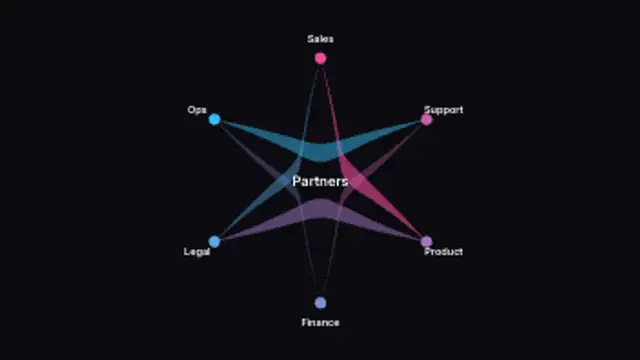
Parties sit around a circle and curved bands link them, each band widening with the weight of the relationship it carries.
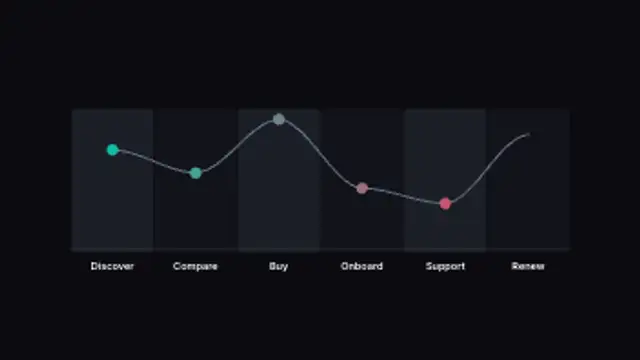
Stages divide the frame into columns and a sentiment line rides across them, rising and dipping to the scores you set per stage.
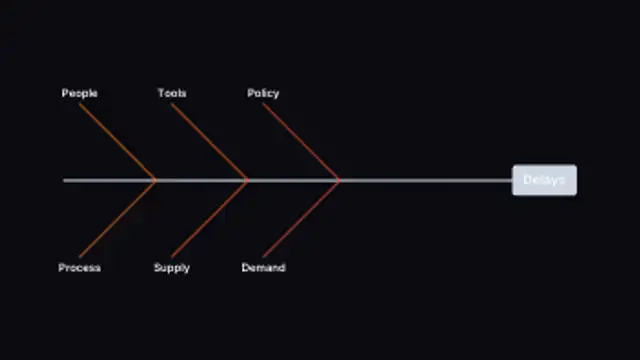
Causes angle off a central spine toward the problem at the head, and the bones respace themselves however many causes you list.
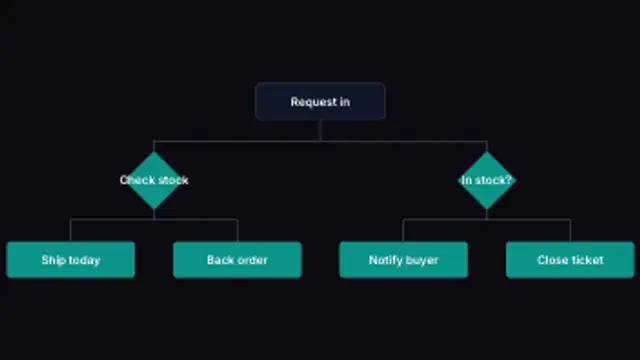
A process branches down the frame, turning every branching step into a decision diamond and routing each connector around it.
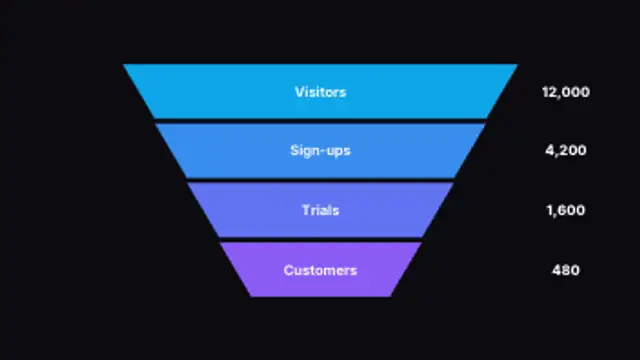
Stages taper down the frame and land one after another, each carrying its own figure so the drop-off reads at a glance.
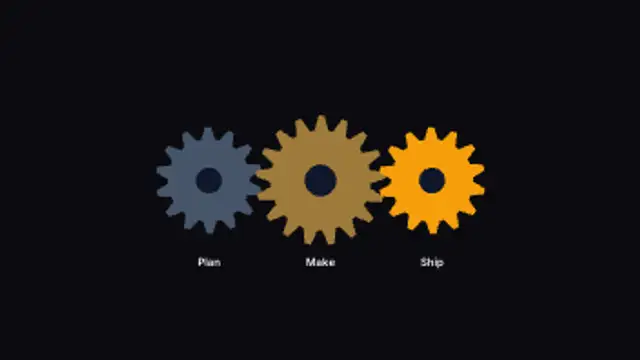
Gear centres are spaced from their own tooth counts so the teeth actually mesh, and neighbours turn in opposite directions at matching speeds.